
The equations for the chemical-hydrodynamics and chemical-thermodynamics of global warming/climate change are non-linear. For this type of physics, the independent variables are (usually) time (t) and energy (h, enthalpy). So, a physical quantity like average global temperature (T) can be taken as related to average CO2 concentration (Xco2) as:
T(Xco2),
but it is not known if this is a single valued function (i.e., has a unique value of T for a unique value of Xco2). The graphs in the article below show examples of functions (curves) that are not single valued. Such multi-valued functions are non-linear. Non-linear functions (in math, and non-linear effects in physics) can exhibit “delays” and abrupt accelerations beyond some threshold value of the driving independent variable.
Now, in the case of our Earth’s climate, CO2 average concentration is a function of time; over time Nature and humanity release more CO2 into the atmosphere:
Xco2(t).
The rate at which these releases occur can vary (some sequence of decreases and increases) over time:
d(Xco2)/dt is itself a function of t.
So, T can be seen to be a nonlinear function explicitly of Xco2 and implicitly of t:
T(Xco2(t)).
Now, realizing that there are hundreds (thousands?, more?) of “variables” that affect the momentary numerical value of T; and with many similar multi-variable — and nonlinear — dependencies of other significant physical and chemical quantities, it is easy to see that simple single-valued (and single independent variable) functional predictability just doesn’t exist for global warming. This is why the popular literature on global warming talks about “thresholds” and “tipping points” — unknown values of a driving independent variable, like Xco2, above which all hell breaks loose.
The purpose of The Latent Heat of Climate Change, is to give an inkling of the unpredictability of nonlinear, multi-variable phenomena, by describing a much simpler and well-known physical phenomena: the liquid-to-vapor phase change of water.
The Latent Heat of Climate Change
29 July 2013
Why is Global Warming stagnating? (1) I do not know the exact answer to this question. However, I do not see the lag of global warming relative to the increase in atmospheric CO2 during the last fifteen years as such a mysterious effect.
Why? Because the entire system of global heat balance and the chemical thermodynamics of the Earth’s atmosphere is extremely complicated, and multiply intertwined.
It is simple-minded to expect such a natural system (organism?, as in Gaia?) to behave mechanically and linearly. That is to say, it is naïve to expect that because data of climate history show that for a lower range of CO2 concentrations in the past the injection of X amount of CO2 into the atmosphere in any given brief period (a year or less) correlated with a parallel increase of Y amount of average temperature, that such a correlation will obtain at any higher level of CO2 concentration now and in the future.
There are so many possible feedback mechanisms and interconnections of chemistry, physics, and heat flow (chemical thermodynamics) in this earth atmosphere system that it is entirely possible for added heat energy to be stored, without temperature change, for a period of time while CO2 concentration increases above some threshold level, TL, until some higher level, TL + XX, at which point a new concentration-temperature correlation would exhibit itself.
I will give one example. When you heat ice water (but not solid ice, let us say liquid at 0 degrees Celsius) to boiling, there is a steady correlation of heat energy into the water (say in joules of energy per gram of H2O) with resultant water temperature: for every degree Celsius rise of water temperature, an amount of energy equal to 4.184 joules has infused each gram of the mass of liquid water. We know that water boils at a temperature of 100 degrees Celsius (at sea level), so we expect our (initially 0 degree C) water to boil — issue steam — once we have infused it with an amount of energy equal to its mass in grams times 418.4 joules (e.g., 418,400 joules for every kilogram). However, this is not the case.
Boiling is the condition where steam, vaporized water, can form and escape from the liquid mass because the vapor bubbles have sufficient energy to exert a comparable pressure to the liquid water from which they bubble out of, and against the atmosphere in which the heating takes place. (And, since atmospheric pressure is less at higher elevations as on the peak of Mount Blanc, the heat input required for boiling — and the resultant boiling temperature — are less than at sea level.)
A great deal of heat energy must be absorbed by the H2O molecules in liquid water that has just reached 100 degrees C, to agitate those molecules (speed up their kinetic motions) sufficiently so they separate widely (in localized spots) to make the “phase transition” from liquid to gas — steam — and then bubble out. This phase transition happens without an increase in temperature because the added energy is being absorbed into breaking the weak molecule-to-molecule attractive electromagnetic forces that make a liquid, and to agitate the molecular bonds of individual H2O molecules (which one can think of as springs between “billiard ball” atomic nuclei, and those springs are set into rotary and vibratory motions by the heat energy they absorb). The energy required to effect the phase transition of vaporization in water is 2260 joules per gram (this is called the “latent heat of vaporization”).
So, vaporizing our sample of water will require an additional 2260 joules of energy for each gram of liquid water that has just reached 100 degrees C. When we “boil water,” we take the first appearance of bubbling and steam emission as a sure sign that the liquid mass has reached 100 degrees C. Our water sample will be fully vaporized after every gram of the liquid (already at 100 C) has absorbed an additional 2260 joules of heat energy.
If we continue to heat our fully vaporized water mass, which is confined within an expanding balloon so its pressure remains constant (as its volume expands), then the steam will increase in temperature in a nearly proportional manner with respect to heat energy input, though not strictly linear (not exactly proportional).
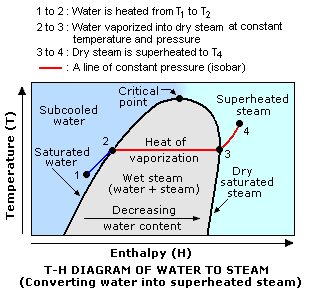
Thus, a graph of water and/or steam temperature (at fixed pressure) with respect to energy input (per gram) would be a rising curve from ice water (0 C at 0 joules/gram of added heat) to the beginning of boiling (100 C at 418.4 joules/gram), then a flat line at 100 C from 418.4 joules/gram to 2678.4 joules/gram, and then a return to a rising trend of steam temperature with added heat energy. The following is a diagram of this process. (2)

Another representation of the thermodynamic data for water is the diagram of pressure-enthalpy at constant temperature. (3)

Note the line labeled “100 C” in the pressure-enthalpy diagram. You can see the flat part over the range of energy-per-gram during which water undergoes its phase transition from liquid to gas (vapor, dry steam). In this flat region, the mass of water is a mixture of liquid water and water vapor. At the left extreme of the flat line (418.4 J/g at 100 C) the sample is 100% liquid, while at the right extreme (2678.4 J/g at 100 C) it is 100% vapor (dry steam).
To keep water in a purely liquid state (no vapor) at a constant temperature requires a drastic increase of the pressure placed upon it (compression). Conversely, to keep water vapor (dry steam, that is to say without liquid droplets) at a constant temperature requires a drastic reduction of the pressure placed upon it (expansion, no condensation).
Each of the constant temperature lines in the pressure-enthalpy diagram shows a correlation of water pressure versus energy input (heating, energy-per-gram). For temperatures below 374.15 degrees C, there is a range of energy-per-gram in which a mixture of two phases of water — liquid and vapor — can coexist (the two phase “vapor dome”). Above 374.15 C, water exists only as vapor (gas) at any pressure.
Perhaps more than you want to know, but the example of a lag in temperature rise with heat input/content over a range of energy-per-mass in a “simple” single substance (a “pure substance” in thermodynamic parlance) like water should make us cautious about expecting an unvarying trend of any correlation between two variables, like CO2 concentration and global average surface temperature (indicative of tropospheric energy-per-mass), in a system (or substance) as incredibly complicated as the atmosphere (in its natural state, influenced by solar radiation and orbital effects).
Also, it is important to realize that global warming and the earth’s average temperature (particularly of the biosphere) is really an effect of the combined atmosphere-ocean system. The oceans are both chemical and heat sinks (they absorb gases, like CO2, and store heat, which is why polar ice shelves are melting). It is very likely that the energy-per-gram of the ocean-atmosphere system has reached some threshold that has triggered one or more unrecognized thermo-chemical cycles that are now absorbing heat and causing the lag we (i.e., climate scientists) observe between continuing CO2 emissions and global average temperature. Imagine an analogy to the vaporization of liquid water.
What is “fundamentally wrong” with climate models is that there is just too much going on in the natural system (Gaia, for romantics) for all of it to be known, or all the knowns-to-exist to be fully understood and mathematically abstracted and included in the computer simulations of the integrated reality of the atmosphere-ocean (and landmass surface) system. One hopes anomalies between theoretical results and measurements in the field, like those discussed by Hans von Storch (1), will enlighten scientists on the unrecognized phenomena and feedback mechanisms, so these processes can be included into new and improved climate models.
The models will never be “perfect” because the idea of being able to abstract all of nature in its expression as the earth’s biosphere, and simulate it computationally and exactly, is pure illusion. The full extent of natural reality is beyond the bounds of human intellect because human intellect is only a small subset of the full extent of natural reality: “Man is something nature is doing” (Alan Watts). However, the models could be refined to the point of being “good enough” — and probably already are — to guide us in making intelligent decisions about the conduct of globalized human social and economic activities. If and how we will are the real questions challenging us today.
Notes
1. Hans von Storch, Why Is Global Warming Stagnating?, https://www.spiegel.de/international/world/interview-hans-von-storch-on-problems-with-climate-change-models-a-906721.html
Also, previous difficulties in gathering geophysical data of climate history, and initial confusion in processing and analyzing it, could have made it seem that there was a “delay” in temperature rise for continuing CO2 input, until after resolution of such unrecognized errors would allow seeing a clear picture of the actual T-versus-CO2 relationship.
2. Temperature-Enthalpy at Constant Pressure
http://en.citizendium.org/images/8/8b/Steam_Temperature-Enthalpy_Diagram.png
3. Pressure-Enthalpy at Constant Temperature
https://www.ohio.edu/mechanical/thermo/property_tables/H2O/ph_water.html
<><><><><><><>
Originally published at Swans.com on 29 July 2013, as:
Why Is Global Warming Stagnating?
Manuel García, Jr.
http://www.swans.com/library/art19/mgarci68.html
<><><><><><><>
The context behind the argument made in The Latent Heat of Climate Change, Redux is given by the following two articles. The first is an outline of the scientific phenomena producing global warming, and the second describes, in general, how those phenomena are abstracted into computer codes, for the numerical simulation of the dynamics of Earth’s climate system.
Closing The Cycle: Energy and Climate Change
25 January 2014
https://manuelgarciajr.com/2014/01/25/closing-the-cycle-energy-and-climate-change/
Climate and Carbon, Consensus and Contention
18 September 2017, (4 June 2007)
https://manuelgarciajr.com/2017/09/18/climate-and-carbon-consensus-and-contention/
<><><><><><><>
The equivalent of “my book,” explaining global warming and climate change science, would be the totality of articles and blog posts collected here, under the title The Latent Heat of Climate Change, Redux. That collection (“my book”) including:
Energy for Society in Balance with Nature
8 June 2015 (27 February 2012)
https://manuelgarciajr.com/2015/06/08/energy-for-society-in-balance-with-nature/
The Atlantic Overturning Current Is Slowing
12 April 2018
https://manuelgarciajr.com/2018/04/12/the-atlantic-overturning-current-is-slowing/
<><><><><><><>
