Earth’s Biosphere Absorbs the Heat Equivalent of 32 Hiroshima Nuclear Explosions Every Second

<><><><><><><><><><><><><><><><><><><><><><><><><><><><><><><><>

Earth’s Biosphere Absorbs the Heat Equivalent of 32 Hiroshima Nuclear Explosions Every Second

A recent news article states that Global Warning (GW) is heating the oceans with an equivalent amount of energy as from 7 Hiroshima atomic bombs every second. [1]

In May 2020, I calculated that the entire biosphere (atmosphere, oceans, land surface) was being heated by 32 Hiroshima-equivalent heat bombs per second.

While it is the atmosphere that initially captures the IR (infrared = heat radiation emitted upward from Earth’s surface) that produces global warming, soon enough about 20-30% of that captured heat is absorbed by the surface waters of the ocean — in a continuous process. One could then say that 6.4-9.6 [6-10, so ~7] of the continuous heat bomb output goes into the oceans and 22.4-25.6 [22-26, so ~25] into the atmosphere — and eventually into the oceans.

The total ocean mass is the long-term repository of global heating — it is a heat battery — and its natural heat leakage rate/time (characteristic cooling time by diffusion, for the exponential decay of ~37%) is ~10,000 years.

But, carbon dioxide (CO2) in the atmosphere might be so long lived — it is ultimately removed by rock weathering, a very slow process — and continue its IR trapping, that the final expulsion of excess ocean heat past the atmosphere and out into space could be delayed much longer. So, the return to pre-industrial atmospheric conditions, regarding carbon dioxide, could be ~100,000 years or more. [2]

Today, the Biosphere is warming at a rate equivalent to it absorbing the total energy used by the United States in all of 2019, every 9 hours and 40 minutes. [3]

The geophysics of all this is fascinating, the quantities of energy and masses, and the magnitudes of spatial dimensions and timescales are awe-inspiring, the implications for human society are beyond Biblically apocalyptic, and the impacts on civil discourse and government policies so far are trivial (beyond one good movie satire in 2021, which you are being instructed to ignore by the fossil-fueled privatized propaganda ministry).

I just wanted to remind everybody.

Notes

[1] Oceans absorbed heat equivalent to seven Hiroshima nuclear explosions every second, expert says
11 January 2022
https://thehill.com/changing-america/sustainability/climate-change/589187-oceans-absorbed-heat-equivalent-to-7-hiroshima

[2] Global Warming is Nuclear War
https://manuelgarciajr.com/2020/05/28/global-warming-is-nuclear-war/

[3] Biosphere Warming in Numbers
https://manuelgarciajr.com/2020/07/03/biosphere-warming-in-numbers/

<><><><><><><>

Earth’s Biosphere Absorbs the Heat Equivalent of 32 Hiroshima Nuclear Explosions Every Second
17 January 2022
https://www.counterpunch.org/2022/01/17/earths-biosphere-absorbs-the-heat-equivalent-of-32-hiroshima-nuclear-explosions-every-second/

<><><><><><><>

Planet Earth Is Heating Up Faster

Planet Earth Is Heating Up Faster

A new scientific paper just accepted for publication by the American Geophysical Union (AGU) shows that, on the basis of both computations and experimental measurements, the net rate at which Planet Earth is absorbing solar energy has increased between years 2005 and 2019. Planet Earth is heating up — global warming — at a faster rate, and that rate is increasing.

In my article here, I will first quote the abstract of this paper (“Satellite and Ocean Data Reveal Marked Increase in Earth’s Heating Rate,” by Norman G. Loeb, Gregory C. Johnson, Tyler J. Thorsen, John M. Lyman, Fred G. Rose, Seiji Kato, 15 June 2021; https://agupubs.onlinelibrary.wiley.com/doi/10.1029/2021GL093047), and then give my interpretation of the overall scientific conclusion, in plain English.

Abstract from the AGU paper:

Earth’s Energy Imbalance (EEI) is a relatively small (presently ∼0.3%) difference between global mean solar radiation absorbed and thermal infrared radiation emitted to space. EEI is set by natural and anthropogenic climate forcings and the climate system’s response to those forcings. It is also influenced by internal variations within the climate system. Most of EEI warms the ocean; the remainder heats the land, melts ice, and warms the atmosphere. We show that independent satellite and in situ observations each yield statistically indistinguishable decadal increases in EEI from mid-2005 to mid-2019 of 0.50±0.47 W m-2 decade-1 (5%-95% confidence interval). This trend is primarily due to an increase in absorbed solar radiation associated with decreased reflection by clouds and sea-ice and a decrease in outgoing longwave radiation (OLR) due to increases in trace gases and water vapor. These changes combined exceed a positive trend in OLR due to increasing global mean temperatures.

MG.Jr. Interpretation:

Earth’s increased temperature has melted ice and snow and reduced cloud cover, which means that less solar radiation (light) is reflected back into space — a warming effect. Note that clouds, snow and ice fields are white and highly reflective of light; bare ground and the ocean surface have much lower reflectivity. Planet Earth’s net reflectivity is called the albedo; and it has decreased.

Even though the increased average global temperature has warmed — stored heat in — the oceans (a 91% effect, as only 9% warms the lands and air) and thus caused greater evaporation of water (and snow melt and ice melt) into the atmosphere, fewer clouds are forming because the higher air temperature keeps the water vapor from condensing as quickly as in previously cooler times. Note that clouds are cold, they are made up of water droplets and ice crystals: condensate from cooled vapor.

However, the ever increasing atmospheric load of carbon dioxide (CO2) and other greenhouse gases that humans cause to be emitted, along with the increased water vapor in the atmosphere, just noted, make for a denser gaseous “filter” or capture medium for the outgoing Infrared Radiation (Outgoing Long-wavelength Radiation = OLR = HEAT) that cools the Earth.

For Planet Earth to be in thermal equilibrium — at a steady average global temperature — the rate of heat-energy radiated out into space (cooling) must equal the rate of light-energy absorbed from the Sun (heating).

The quantity of thermal-energy emission per unit time (OLR) from any isolated body (like Planet Earth suspended in space) increases as its temperature increases. This phenomenon is known as the “blackbody radiation” effect in physics, and quantified by the Stephan-Boltzmann Law. So, one might have hoped that with Planet Earth’s now higher average temperature that it would reject heat (and cool) at a higher rate; and in that way seek to maintain a steady planetary temperature.

BUT the AGU paper shows that the decrease of Earth’s light reflectivity (albedo), combined with the increase of its OLR (heat) absorptivity by the atmosphere, overwhelm the also increased rate of heat (IR or OLR) emission from the planetary surface back towards space.

The net effect is an increase in the rate at which originally-solar energy is absorbed by Planet Earth, and hence an increase in the rate at which Planet Earth’s average temperature is increasing. This is a self-reinforcing effect, a.k.a.: a vicious cycle.

Immediately ceasing “all” (the vast majority of) emissions of carbon-dioxide and greenhouse gases is the first essential step to SLOWING the rate of global warming and attendant “climate change”, and the absolute beginning of a very long process of global temperature equilibration:

1, from a slowing of the rising trend of temperature;

2, until temperature reaches a plateau; because it takes decades to centuries for the oceans and lands to reach a temperature equilibrium — think of equilibrium as “uniformity,” though that analogy is not exact;

3, and then the slow (decades to centuries) re-absorption of CO2 from the atmosphere by the surface waters of the oceans and photosynthesis (plants);

4, with a gradual (centuries to millennia) reduction of global temperature.

It took 200,000 years to clear away the global warming “hyperthermal” event known as the Paleocene-Eocene Thermal Maximum (PETM), which occurred ~55.5 million years ago.

The sooner the emissions of greenhouse gases cease: the lower the height of the inevitable maximum temperature plateau, and the shorter the duration of the period before temperature returns to “normal” (as in the Holocene). Regardless, that duration will be vastly longer than a human lifetime, and even many human generations.

The social and political implications of these scientific findings quickly become obvious on honest reflection.

[Thanks to Peter Carter for the AGU reference.]

<><><><><><><>

Ocean Heat, From the Tropics to the Poles

The heat being captured by the increasing load of carbon dioxide and other greenhouse gases in the atmosphere is subsequently transferred into the oceans for storage. This process — global warming — has raised the temperature of the biosphere by 1°C (or more) since the late 19th century.

Heat introduced into any material body at a particular point will diffuse throughout its volume, seeking to smooth out the temperature gradient at the heating site. If heat loss from that body is slow or insignificant, then a new thermal equilibrium is eventually achieved at a higher average temperature.

Thermal equilibrium does not necessarily mean temperature homogeneity, because the body may have several points of contact with external environments at different temperatures that are held constant, or with other external thermal conditions that must be accommodated to. Equilibrium simply means stable over time.

The heat conveyed to the oceans by global warming is absorbed primarily in the Tropical and Subtropical latitudes, 57% of the Earth’s surface. The Sun’s rays are more nearly perpendicular to the Earth’s surface in those latitudes so they receive the highest fluxes of solar energy, and oceans cover a very large portion of them.

That tropical heat diffuses through the oceans and is also carried by ocean currents to spread warmth further north and south both in the Temperate zones (34% of the Earth’s surface) and the Polar Zones (8% of the Earth’s surface).

What follows is a description of a very idealized “toy model” of heat distribution in the oceans, to help visualize some of the basics of that complex physical phenomenon.

Heat Conduction in a Static Ocean

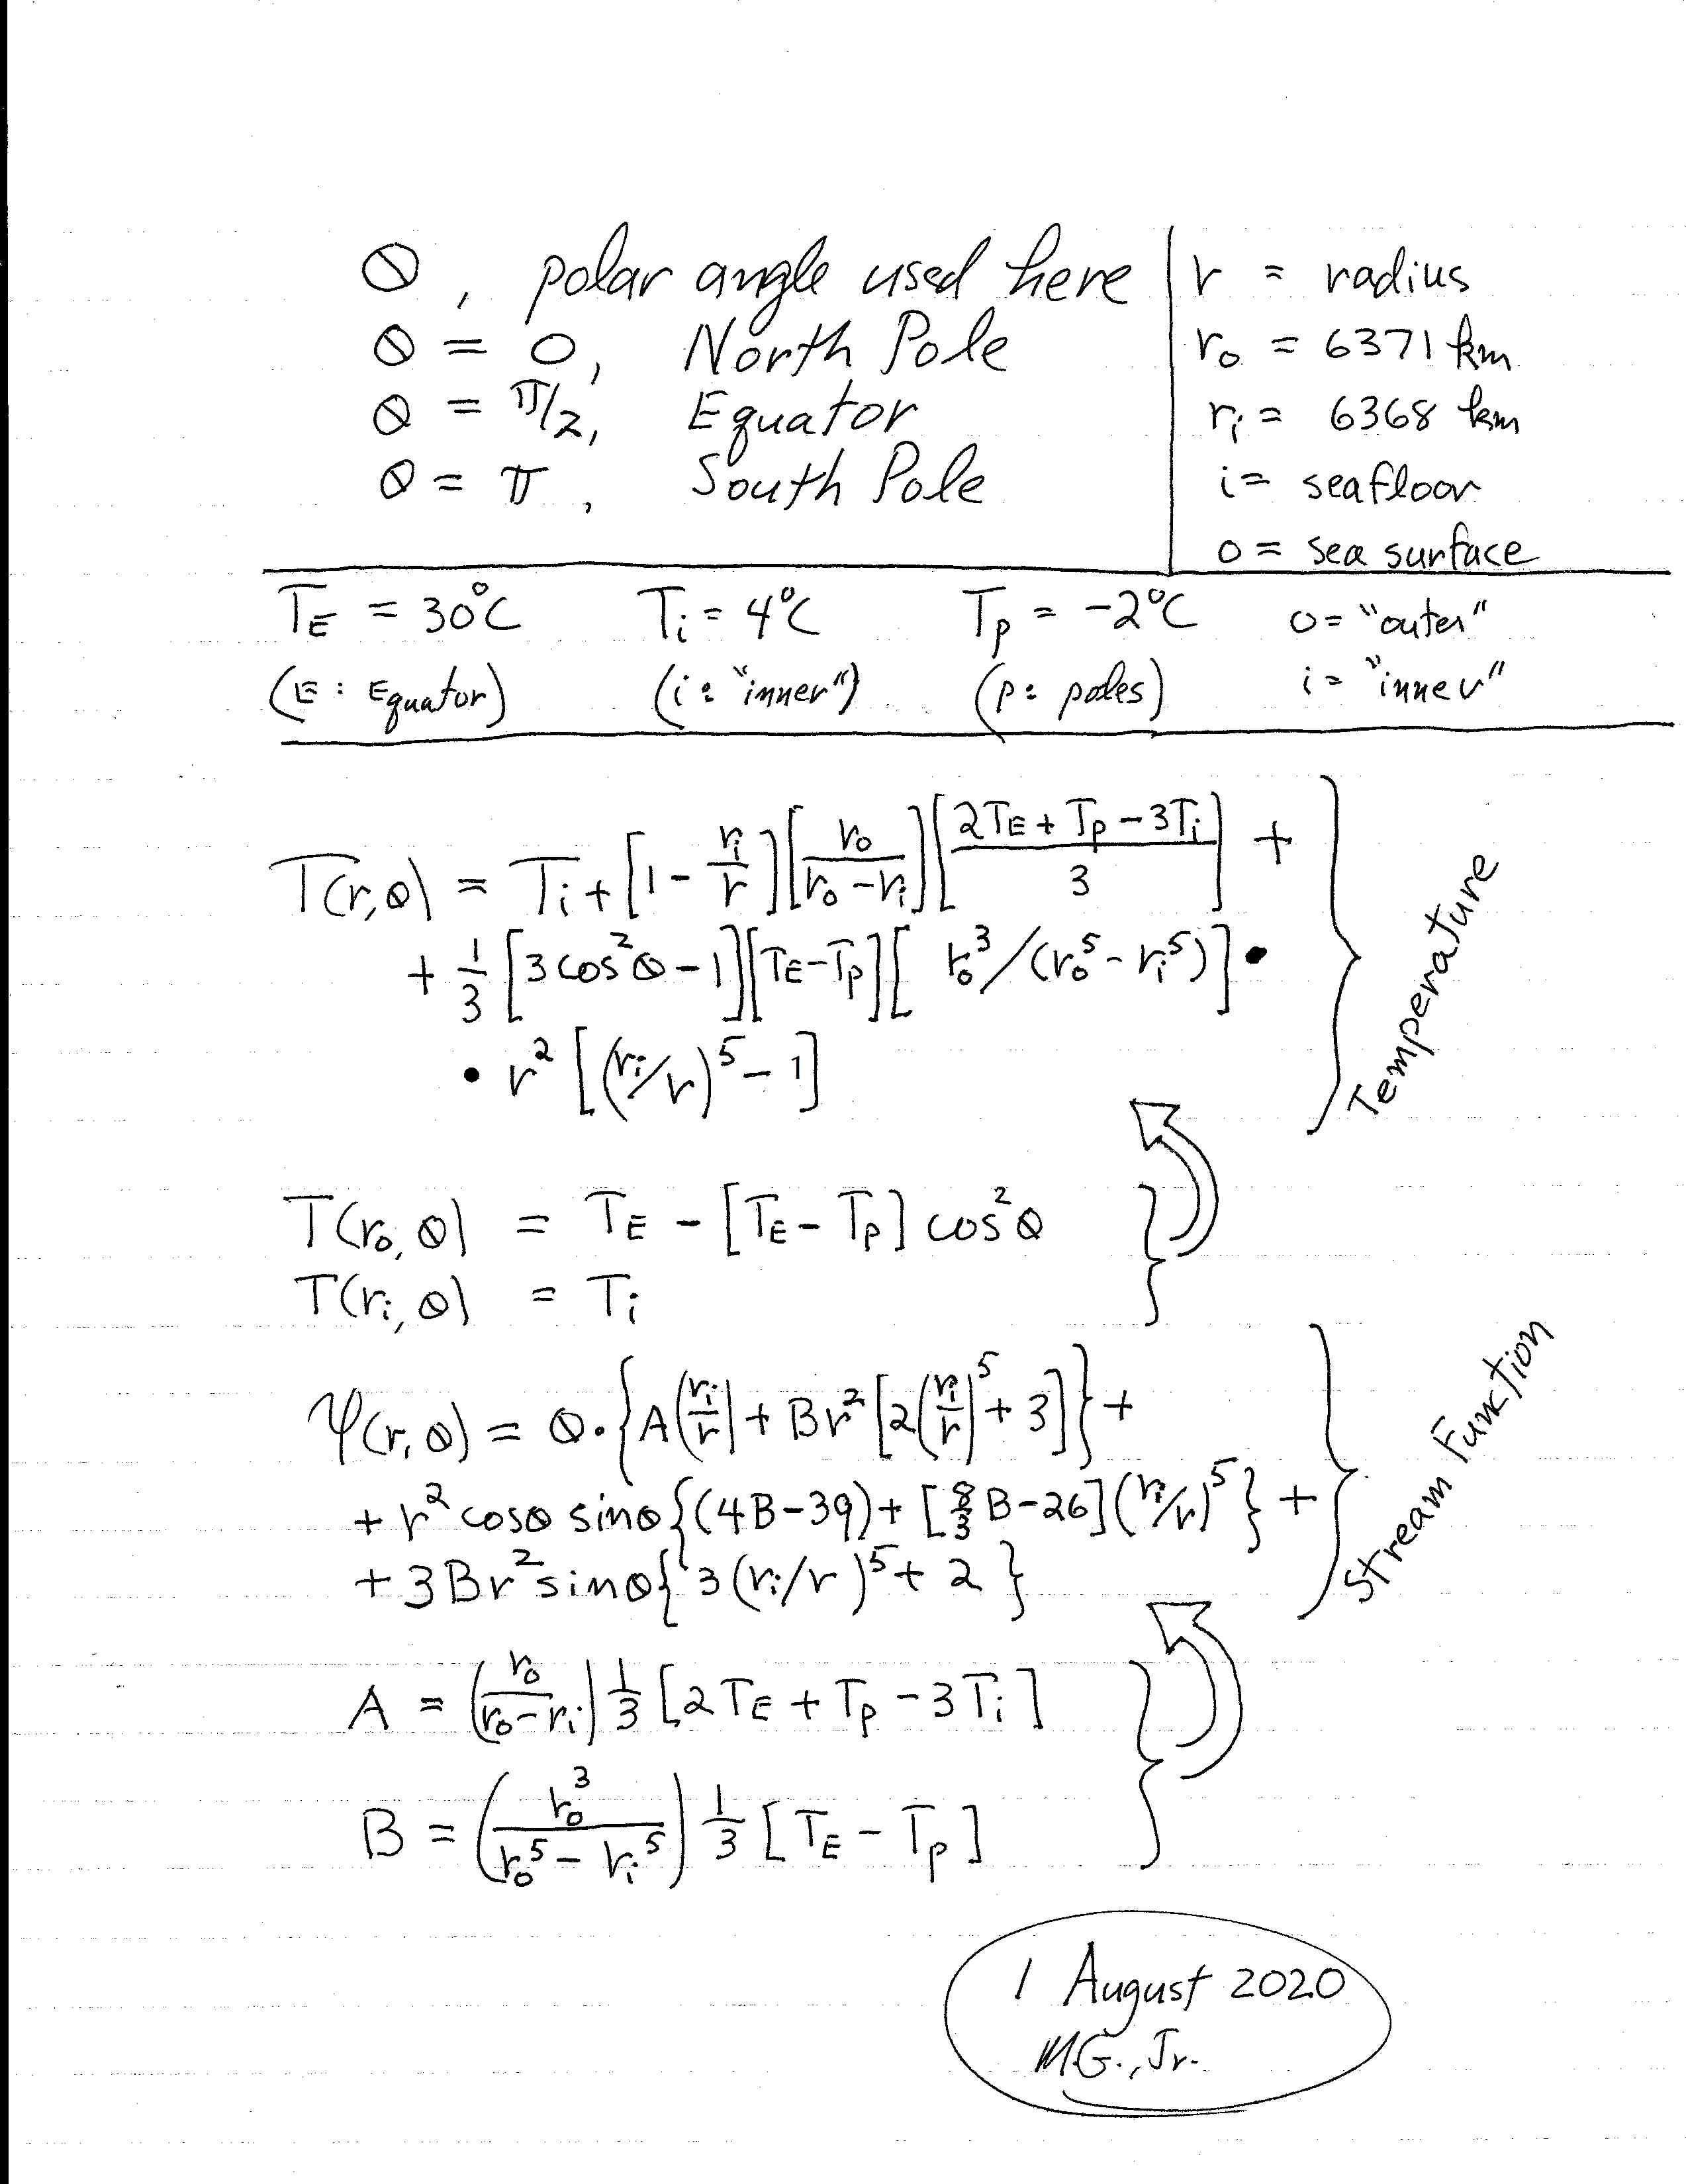
The model is of a stationary spherical globe entirely covered by a static ocean of uniform depth. The seafloor of that ocean is at a constant temperature of 4°C (39°F), the surface waters at the equator are at 30°C (86°F), and the surface waters at the poles are at -2°C (28°F). These temperature conditions are similar to those of Earth’s oceans. These temperature boundary conditions are held fixed, so an equilibrium temperature distribution is established throughout the volume in the model world-ocean. There is no variation across longitude in this model, only across latitude (pole-to-pole). (See the Notes on the Technical Details)

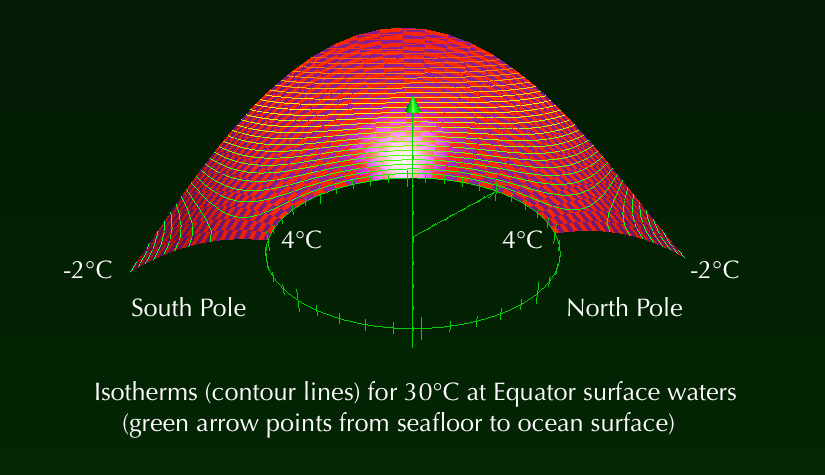
Figure 1 shows contours of constant temperature (isotherms) throughout the depth of the model ocean, from pole to pole. The temperature distribution is shown as a 3D surface plotted against depth, which is in a radial direction in a spherical geometry, and polar angle (from North Pole to South Pole).

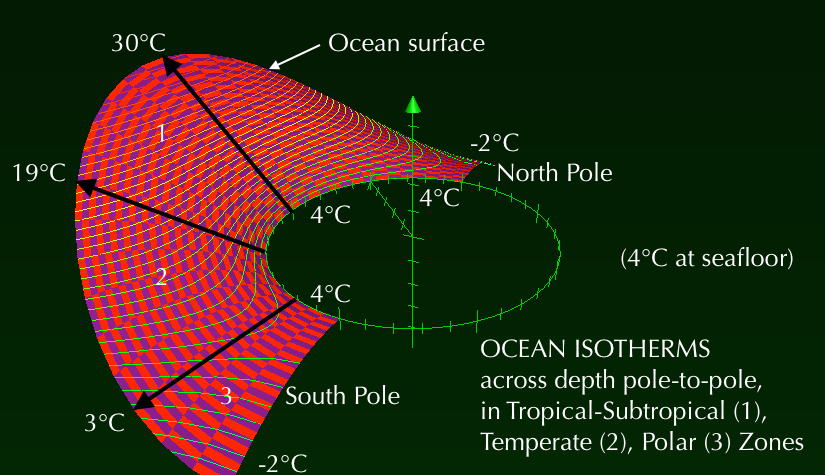
Figure 2 is a different view of the temperature distribution. Three regions are noted: The Tropical Zone (from 0° to 23° of latitude, north or south) combined with the Subtropical Zone (from 23° to 35° of latitude, north or south); the Temperate Zone (from 35° to 66° of latitude, north or south); and the Polar Zone (from 66° to 90° of latitude, north or south).

The model temperature distribution is perfectly stratified — isotherms uniform with depth — in the Tropical-Subtropical Zones, from 30°C at the surface at the equator, to 4°C at the seafloor. On entering the Temperate Zones, the isotherms arc up into a nearly radial (vertical) orientation. In the small portions of the planetary surface covered by the Polar Zones the isotherms are now more horizontally stratified because the surface waters are chillier that the those at the seafloor.

Figure 3 shows the streamlines of heat flow (the temperature gradient) for this temperature distribution. At the equator the heat is conducted down from the 30°C surface to the 4°C seafloor. As one moves further away from the equator the streamlines become increasingly lateral, until they are entirely so at 35° of latitude (north or south) where the model surface waters are at 19°C. The heat flow is entirely horizontal at this latitude, which separates the Subtropical and Temperate Zones; tropical heat is being conducted laterally toward the poles. In the Polar Zones the heat flow is up from the lower depths because the surface waters are chiller than those at depth, and because there is too little temperature variation with distance along the surface to drive a lateral heat flow.

Thermally Driven Surface Currents

Much oceanic heat is distributed by currents, and many of these occur along the surface.

The average speed of the Gulf Stream is 6.4km/hr (4mph), being maximally 9kph (5.6mph) at the surface but slowing to 1.6kph (1mph) in the North Atlantic, where it widens (information from the National Oceanic and Atmospheric Administration, NOAA).

Heat-driven equator-to-poles surface currents on the model ocean were estimated from the combination of the pole-to-pole surface temperature distribution, and thermodynamic data on liquid water. (See the Notes on the Technical Details)

The pressure built up by tropical heat in the model ocean’s equatorial waters pushes surface flows northward (in the Northern Hemisphere) and southward (in the Southern Hemisphere): from a standstill at the 30°C equator; with increasing speed as they recede from the equator, being 2kph (1.3mph) where the surface waters are at 25°C (77°F); a continuing acceleration up to a speed of 2.8kph (1.7mph) at the 35° latitude (the boundary between the Subtropical and the Temperate Zones); and an ultimate speed of 3.6kph (2.2mph) at the poles.

The currents are converging geometrically as they approach the poles, so a speed-up is reasonable. Logically, these surface currents are legs of current loops that chill as they recede from the equator, plunge at the poles, run along the cold seafloor toward the equator, and then warm as they rise to the surface to repeat their cycles.

An equator-to-pole average speed for these model surface currents is 2.8kph (1.7mph). Their estimated travel times along the 10,008km surface arc (for a model world radius of 6,371km, like that of a sphericalized Earth) is 3,574 hours, which is equivalent to 149 days (0.41 year).

Greater Realities

The model world just described is very simple in comparison to our lovely Earth. Since it does not rotate, it does not skew the north-south flow of currents that — with the help of day-night, seasonal, and continental thermodynamic inhomogeneities — creates all of the cross-longitudinal air and ocean currents of our Earth.

The irregularity of seafloor depth on Earth also redirects cross-latitudinal (pole-to-pole) and cross-longitudinal bottom currents, as do the coastlines of the continents; and the very slight and subtle changes in seawater density with temperature and salinity — neither of which is distributed uniformly throughout the body of Earth’s oceans — also affect both the oceans’s volumetric temperature distributions, and the course of ocean currents.

Recall that the model ocean is bounded by constant imposed temperature conditions at its seafloor (4°C) and surface waters (a particular temperature distribution from 30°C at the equator, to -2°C at the poles). Since this model world is otherwise suspended in a void, if these boundary conditions were removed the oceanic heat concentrated at the equator would diffuse further into the watery volume, seeking to raise the temperatures of the poles and seafloor while simultaneously cooling the equatorial region. The ultimate equilibrium state would be an ocean with a constant temperature throughout its volume.

Additionally, if it is also assumed that the now “liberated” model ocean-world can radiate its body heat away — as infrared radiation into the void of space — then the entire planet with its oceanic outer shell slowly cools uniformly toward -273.16°C (-459.69°F), which is the “no heat at all” endpoint of objects in our physical Universe.

When our Earth was in its Post-Ice Age dynamic thermal equilibrium, the “heat gun” of maximal insolation to the Tropics and Subtropics warmed the oceans there; a portion of that heat was conducted and convected into the Temperate Zones and toward the Poles; where the “ice bags” of masses of ice absorbed seasonal oceanic heat by partially melting — which occurs at a constant temperature — and then refreezing. Also, the atmosphere did not trap the excess heat radiated into space. In this way cycles of warming and cooling in all of Earth’s environments were maintained in a dynamic balance that lasted for millennia.

What has been built up in the atmosphere since about 1750 is an increasing load of carbon dioxide gas and other greenhouse gases, which have the effect of throwing an increasingly heated “thermal blanket” over our planet. Now, both the heat conduction pathways and the heat convection currents, described with the use of the model, convey increasing amounts of heat energy over the course of time. As a result the masses of ice at the poles are steadily being eroded by melting despite their continuing of cycles of partial re-freezing during winter, and additional melting during summer.

Simple mathematical models can help focus the mind on the fundamental processes driving complex multi-entangled physical realities. From there, one can begin assembling more detailed well-organized quantitative descriptions of those realities, and then using those higher-order models to inform decisions regarding actions to be taken in response to those realities, if responses are necessary. This point of departure from physics plunges you into the world of psychology, sociology, economics, politics, and too often sheer madness. I leave it to another occasion to comment outside my field of expertise about all that.

Notes on the Technical Details

The cylindrically symmetric equilibrium temperature distribution for a static ocean of uniform depth, which entirely covers a spherical planet, was solved from Laplace’s equation. The temperature of the seafloor everywhere is 4°C, the surface waters at the Equator are at 30°C, and the surface waters at the poles are at -2°C. The variation of surface water temperature with respect to polar angle (latitude) is in a cosine squared distribution. Displays of the 3D surface T(r,ɵ) show isotherms down through the ocean depths at all polar angles (ɵ). The contour lines on the stream function associated with T(r,ɵ) are heat flow streamlines, the paths of the heat gradient (which are always perpendicular to the isotherms).

Bernoulli’s Theorem was applied to surface flow from the equator to the poles (no radial, nor cross-longitudinal motion) for incompressible liquid water with thermal pressure given by:

P(T°C)=[62.25kg/m-sec^2]*exp{0.0683*[T(R,ɵ)-Tp]}

for R equal to the planetary radius to the ocean surface; Tp=-2°C; and using thermodynamic data for water between 32°F (0°C) and 100°F (37.8°C) that indicates a thermal pressure equal to 62.25kg/m-sec^2 in liquid water at 0°C; and that the density of water is essentially constant at 1000kg/m^3 (for the purposes of this model) within the temperature range of the data surveyed.

Inserting P(T°C) into the Bernoulli Theorem definition of equator-to-pole lateral (cross-latitudinal) velocity gives a formula for that velocity as a function of polar angle:

v(ɵ)=±sqrt{(2*[62.25kg/m-sec^2]/[1000kg/m^3])*exp[0.0683*(Te-Tp)]*[1-exp(-0.0683*[Te-T(R,ɵ)])]}

v(ɵ)=±(1.0523m/s)*sqrt{1-exp(-0.0683*[Te-T(R,ɵ)])}

for Te=30°C, and ± for northward (in the Northern Hemisphere) or southward (in the Southern Hemisphere) surface flows.

<><><><><><><>

<><><><><><><>

Biosphere Warming in Numbers

<><><><><><><><><><><><><><><><><><><><><><><><><><><><><><><><>

Biosphere Warming in Numbers

At this time, the Biosphere is warming at a rate of 3.03×10^15 Watts, which is equivalent to a temperature rate-of-rise of 0.0167°C/year. The warming rate has been increasing steadily since the 19th century, when it was on average “zero” except for natural fluctuations (plus and minus) that were hundreds of times smaller than today’s warming rate.

The total energy use by the United States in 2019 was 100 quadrillion BTU (British Thermal Units), which is equivalent to 1.055×10^20 Joules. Averaged out over the 31,557,600 seconds in a year implies a use rate of 3.34×10^12 Watts during 2019.

From the above two observations, we can deduce that the current rate of Biosphere warming on a yearly basis is equivalent to the yearly energy use in 2019 of 907 United States of Americas.

The total increase in the heat energy of the Biosphere since 1910 is 5.725×10^24 Joules, with a corresponding increase of its temperature by 1°C. That heat energy increase over the last 110 years is equivalent to 54,260 years of U.S. energy use at its 2019 amount, per year.

So, today the Biosphere is warming at a rate equivalent to it absorbing the total energy used by the U.S. in 2019, every 9 hours and 40 minutes.

In 2008, I estimated the energy of a large hurricane to be 6.944×10^17Joules. [1] Thus, 152 such hurricanes amount to the same total energy as that used by the U.S. during 2019.

The heat energy increase of the Biosphere during 2019 was 9.56×10^22 Joules, with a corresponding temperature increase of 0.0167°C. That heat energy increase is the energetic equivalent of 137,741 hurricanes. Now, of course, that Biosphere heat increase during 2019 did not all go into making hurricanes, but it should be easy enough to see that a small fraction (for a whopping amount) went into intensifying the weather and producing more and stronger hurricanes (and consequent flooding).

Two clear observations from all this are:

– the Biosphere is warming at an astounding rate, even if “we don’t notice it” because we gauge it by the annual change in average global surface temperature (which is in hundredths of degrees °C per year);

– the immense amount of heat added to the Biosphere every year is increasingly intensifying every aspect of weather and climate, and consequently driving profound changes to all of Earth’s environments.

Those environmental changes directly affect habitability, and species viability, because they are occurring at a rate orders of magnitude faster than the speed at which biological evolution can respond to environmental pressures.

What should we do about it all?

That is obvious: ditch capitalism and socio-economic inequities worldwide; ditch all forms of bigotry, intolerance, racism, war and social negativity; form a unified planetary political administration for the management of a socialist Earth; deploy reasonable technical mitigation strategies (like drastic reductions in the use of fossil fuels, transforming the transportation infrastructure); implement very deep and comprehensive social adaptation behaviors (“lifestyle changes,” eliminating consumerism, scrupulously protecting biodiversity, resettlement of populations displaced by permanent inundation or uninhabitable drought and heat, worldwide sharing of food production).

None of this will actually stop global warming, as the amount of carbon dioxide already in the atmosphere (assuming it has a lifetime there of thousands of years [2]) has us programmed to warm by about another 1°C to 2°C within two centuries, even if we immediately and permanently shut off all our greenhouse gas emissions.

But, such an improved civilization would experience the least amount of suffering — which would be equitably distributed — from the consequences of advancing global warming; and it would contribute minimally toward exacerbating future global warming.

Notes

[1] The Energy of a Hurricane
5 September 2008
https://www.counterpunch.org/2008/09/05/the-energy-of-a-hurricane/

[2] Global Warming and Cooling After CO2 Shutoff at +1.5°C
20 June 2020
https://manuelgarciajr.com/2020/06/20/global-warming-and-cooling-after-co2-shutoff-at-1-5c

<><><><><><><>