Anthropocene Joyride

National Research Council, 2011: ‘Understanding Earth’s Deep Past: Lessons for Our Climate Future.’

<><><><><><><><><><><><><><><><><><><><><><><><><><><><><><><><>

Anthropocene Joyride

The Anthropocene geological epoch began when human activity first had a GLOBAL impact on the planet’s environments. That was in late 1965, when the first evidence of a human-caused effect was detected EVERYWHERE, indicating a simultaneous global impact by human activity.

That evidence was the signature of radioactivity (Carbon-14) from nuclear bomb test fallout incorporated into tree rings for the year 1965 (within October to December) at all latitudes and longitudes. Atmospheric nuclear bomb explosions were set off from 1945 to, primarily, 1963. The peak of such activity was an orgy of bomb tests by the U.S. and USSR in 1962. [1]

Prior to 1965 many species had had geographically limited impact on altering environments, like pre-columbian humans in North America making pastures out of forests in Appalachian valleys, herd animals making permanent migration trails, and grazing animals nibbling bush down to grasslands.

But all previous geological epochs were set by planetary geophysics, such as with the coalescing of continents into the supercontinent Pangaea (335Mya) and then its breakup (from 175Mya), and the comings and goings of the Ice Ages, the last one starting 2.58Mya, and ending 11,700 years ago.

While we now know that human activity can have a simultaneous global impact for setting off a planetary geophysical process — global warming climate change with biodiversity losses — we do not yet know if human activity can set off a different planetary geophysical process to counter global warming climate change and biodiversity losses.

It is obvious that the only credible global climate stabilizing process available is the socio-economic revolution of abandoning nationalistic fossil-fueled capitalism, and replacing it with an international democratic socialism whose industrial and technological elements are powered by renewable energy, which does not emit greenhouse gases. [2]

Such a necessary transformation of organized human society is most definitely a challenge to the political processes of Earth’s 193-odd nations, and to the ambitions and prejudices of their political classes, their wealth elites, and their general populations. The practical problem facing climate stabilization activists is to overcome these political difficulties as soon as possible. Admittedly, this is a monumental task, and some fear it impossible. Even so, defeatism here is ignominious while engagement in this cause will at a minimum salvage personal honor, and most optimistically secure humanity’s long-term future.

So for now it is best to think of humans as in the driver’s seat of the Anthropocene Earth Car with the foot mashed down on the gas pedal connected to a powerful fuel-injected engine, but with the brake lines cut. Time of impact is unknown, but terminal speed will be high.

Notes

[1] The Anthropocene’s Birthday
https://manuelgarciajr.com/2018/02/23/the-anthropocenes-birthday/

[2] The Improbability of CO2 Removal from the Atmosphere
https://manuelgarciajr.com/2020/08/09/the-improbability-of-co2-removal-from-the-atmosphere/

<><><><><><><>

Planet Earth Is Heating Up Faster

Planet Earth Is Heating Up Faster

A new scientific paper just accepted for publication by the American Geophysical Union (AGU) shows that, on the basis of both computations and experimental measurements, the net rate at which Planet Earth is absorbing solar energy has increased between years 2005 and 2019. Planet Earth is heating up — global warming — at a faster rate, and that rate is increasing.

In my article here, I will first quote the abstract of this paper (“Satellite and Ocean Data Reveal Marked Increase in Earth’s Heating Rate,” by Norman G. Loeb, Gregory C. Johnson, Tyler J. Thorsen, John M. Lyman, Fred G. Rose, Seiji Kato, 15 June 2021; https://agupubs.onlinelibrary.wiley.com/doi/10.1029/2021GL093047), and then give my interpretation of the overall scientific conclusion, in plain English.

Abstract from the AGU paper:

Earth’s Energy Imbalance (EEI) is a relatively small (presently ∼0.3%) difference between global mean solar radiation absorbed and thermal infrared radiation emitted to space. EEI is set by natural and anthropogenic climate forcings and the climate system’s response to those forcings. It is also influenced by internal variations within the climate system. Most of EEI warms the ocean; the remainder heats the land, melts ice, and warms the atmosphere. We show that independent satellite and in situ observations each yield statistically indistinguishable decadal increases in EEI from mid-2005 to mid-2019 of 0.50±0.47 W m-2 decade-1 (5%-95% confidence interval). This trend is primarily due to an increase in absorbed solar radiation associated with decreased reflection by clouds and sea-ice and a decrease in outgoing longwave radiation (OLR) due to increases in trace gases and water vapor. These changes combined exceed a positive trend in OLR due to increasing global mean temperatures.

MG.Jr. Interpretation:

Earth’s increased temperature has melted ice and snow and reduced cloud cover, which means that less solar radiation (light) is reflected back into space — a warming effect. Note that clouds, snow and ice fields are white and highly reflective of light; bare ground and the ocean surface have much lower reflectivity. Planet Earth’s net reflectivity is called the albedo; and it has decreased.

Even though the increased average global temperature has warmed — stored heat in — the oceans (a 91% effect, as only 9% warms the lands and air) and thus caused greater evaporation of water (and snow melt and ice melt) into the atmosphere, fewer clouds are forming because the higher air temperature keeps the water vapor from condensing as quickly as in previously cooler times. Note that clouds are cold, they are made up of water droplets and ice crystals: condensate from cooled vapor.

However, the ever increasing atmospheric load of carbon dioxide (CO2) and other greenhouse gases that humans cause to be emitted, along with the increased water vapor in the atmosphere, just noted, make for a denser gaseous “filter” or capture medium for the outgoing Infrared Radiation (Outgoing Long-wavelength Radiation = OLR = HEAT) that cools the Earth.

For Planet Earth to be in thermal equilibrium — at a steady average global temperature — the rate of heat-energy radiated out into space (cooling) must equal the rate of light-energy absorbed from the Sun (heating).

The quantity of thermal-energy emission per unit time (OLR) from any isolated body (like Planet Earth suspended in space) increases as its temperature increases. This phenomenon is known as the “blackbody radiation” effect in physics, and quantified by the Stephan-Boltzmann Law. So, one might have hoped that with Planet Earth’s now higher average temperature that it would reject heat (and cool) at a higher rate; and in that way seek to maintain a steady planetary temperature.

BUT the AGU paper shows that the decrease of Earth’s light reflectivity (albedo), combined with the increase of its OLR (heat) absorptivity by the atmosphere, overwhelm the also increased rate of heat (IR or OLR) emission from the planetary surface back towards space.

The net effect is an increase in the rate at which originally-solar energy is absorbed by Planet Earth, and hence an increase in the rate at which Planet Earth’s average temperature is increasing. This is a self-reinforcing effect, a.k.a.: a vicious cycle.

Immediately ceasing “all” (the vast majority of) emissions of carbon-dioxide and greenhouse gases is the first essential step to SLOWING the rate of global warming and attendant “climate change”, and the absolute beginning of a very long process of global temperature equilibration:

1, from a slowing of the rising trend of temperature;

2, until temperature reaches a plateau; because it takes decades to centuries for the oceans and lands to reach a temperature equilibrium — think of equilibrium as “uniformity,” though that analogy is not exact;

3, and then the slow (decades to centuries) re-absorption of CO2 from the atmosphere by the surface waters of the oceans and photosynthesis (plants);

4, with a gradual (centuries to millennia) reduction of global temperature.

It took 200,000 years to clear away the global warming “hyperthermal” event known as the Paleocene-Eocene Thermal Maximum (PETM), which occurred ~55.5 million years ago.

The sooner the emissions of greenhouse gases cease: the lower the height of the inevitable maximum temperature plateau, and the shorter the duration of the period before temperature returns to “normal” (as in the Holocene). Regardless, that duration will be vastly longer than a human lifetime, and even many human generations.

The social and political implications of these scientific findings quickly become obvious on honest reflection.

[Thanks to Peter Carter for the AGU reference.]

<><><><><><><>

From Caesar’s Last Breath To Ours

After the career: books donated in 2019.

<><><><><><><><><><><><><><><><><><><><><><><><><><><><><><><><>

From Caesar’s Last Breath To Ours

Human Life is a sexually transmitted planetary disease, Climate Change is the disinfectant that will cure it. (I’ll explain myself on this later.)

Sam Kean’s concluding 5 paragraphs, on CO2 in the atmosphere, from his book Caesar’s Last Breath (And Other True Tales of History, Science, and the Sextillions of Molecules in the Air Around Us, 2017, Back Bay Books, Little Brown & Co) are interesting, being a series of statements of long-known physical quantities. Since I studied “gas physics” for my graduate studies (in the 1970s), and I developed an interest in climate change at least by 2004 (when I published my first article on climate change), I’ve known the basic facts Kean commented on for quite some time.

In one of my technical books on gas physics (Introduction to Physical Gas Dynamics, by Walter G. Vincenti and Charles H. Kruger, 1965, John Wiley & Sons, NY) an example is given in which the authors illustrate the physical phenomena of gaseous diffusion by showing that the last breath expelled by Julius Caeser will have taken years to fully disperse in a homogenous manner throughout the earth’s atmosphere, and so each person ‘today’ would likely breath in, on average, 5 molecules of that last breath. One amazing feature of the example is that it shows just how many molecules there are in each cubic meter of air (at sea level and ‘normal’ temperature), 2.69×10^25 per meter^3 = 2.69×10^19 per cm^3. Vincenti and Kruger quote the following from James Jeans’ 1940 book An Introduction to the Kinetic Theory of Gases (Cambridge University Press):

“…, a man is known to breath out about 400 c.c. of air at each breath, so that a single breath of air must contain about 10^22 molecules. The whole atmosphere of the earth consists of about 10^44 molecules. Thus one molecule bears the same relation to a breath of air as the latter does to the whole atmosphere of the earth. If we assume that the last breath of, say, Julius Caesar has by now become thoroughly scattered through the atmosphere, then the chances are that each of us inhales one molecule of it with every breath we take. A man’s lungs hold about 2000 c.c. of air, so that the chances are that in the lungs of each of us there are about five molecules from the last breath of Julius Caesar.”

The average spacing between air molecules (at sea level, or “standard temperature and pressure” = STP) is about 3.3×10^-7 centimeters. Since air molecules travel at an average speed of 5×10^4 centimeters/second (at STP), and each such molecule travels an average distance of 6×10^-6 centimeters before colliding into another molecule (obviously whizzing by many others between collisions), the frequency of collisions per molecule is about 10^10 collisions/second, or about 10 collisions per nanosecond.

Each such collision will deflect the colliding molecules into new directions of travel, so it can take them a very long time to actually transport from Point A to Point B separated by global distances. One number bandied about by commentators on climate change (who at least halfway know what they’re talking about) is that it takes “30 years” for local CO2 emissions to begin having a “global effect” as part of global warming. This is basically the timescale of atmospheric homogenization by diffusion of the locally emitted plumes, because of course the individual CO2 molecules of such plumes are quite ready to absorb infrared radiation, and lose it as heat released to other air molecules during collisions (the actual mechanics of global warming) from the instant those CO2 molecules are formed.

A different indicator of atmospheric trace gas homogenization is that a uniform (independent of geographical location) quantity per unit mass of radioactive fallout absorption/take-up by trees was first measured (recently, from tree corings) to have occurred in late 1965. Radioactive fallout was first created in 1945, and the greatest number of atmospheric (and any) nuclear explosions, by far, occurred in 1962. Some geologists have now proposed labeling the beginning of the Anthropocene from late 1965, and calling that year the end of the Holocene (which is/was the current geological epoch, which began with the last glacial period/retreat approximately 11,650 years ago). “Anthropocene” because it is the first epoch in which human activity (anthropo) has a global geophysical impact; such impacts being worldwide nuclear fallout (as in the 1957 book and 1959 movie On The Beach), and anthropogenic CO2/greenhouse gas-driven global warming.

When I first wrote about global warming/climate change, it was out of this perspective as a gas physicist trying to explain the technical details to a lay audience. I soon learned that the audience was not only laying, but snoring. I was trying to prod “people” into action to forestall climate change by “greening” energy technology, since I was also an engineer focused on “energy” and “efficiency.” Plus I was hoping a huge public shift in this direction would open up some nice ($$$) job opportunities for me. But the snoozing audience just wants consumerism at the lowest common denominator level, and the Big Bosses just want bombs (and money for themselves). So no sweet high-tech green-physics job for me, but more firepower for the ‘criminalated’ psychopaths who are our guiding self-worshipping self-imagined Olympians, more gargantuan Black Friday tsunamis of electro-plastic garbage consumerism for the ‘amnesiatariat,’ and as a result giga-tons more carbonation of the atmosphere and acidification of the seas, and less viability for our planet with its growing human population.

Since “the human element” (mental inertia, ego, tribalism) always controls and limits the actualization of any technical enterprise by a group of people — like greening away from fossil fuels — it was quickly obvious to me that though most “solar energy” technologies were ancient and well-understood “we” were not going to give up fossil fuel convenience, wealth-generation and enablement-of-political-power in favor of green energy, and so consequently global warming could only increase. And it has, and will. So I write about climate change “for the art of it” and for personal satisfaction, in particular to put my views “on the record” for my children. But I can only fantasize, without belief, that such writing will have any practical political effect — of course I’d like it to, but I’m a realist. Happily, it’s always nice to hear every now and then from someone who already agrees with my views, that something I’ve written has given them some encouragement.

And that is where the arc of my climate change consciousness — from the science to our society — has brought me to today: human connection. Given that fossil fueled humanity is intransigent, and now the advance of climate change is implacable (“tipping points”), I see the best focus for most people’s limited energies beyond their immediate survival and family needs to be the developing of a consciousness of climate change and political reality, and a commitment to acting toward others at a minimum with benign neutrality and better yet with compassion, honesty and solidarity, so human society is generally improved and economically more leveled, regardless of the geophysical conditions under which it exists at any given time. For a society that is as deeply humane as I’ve suggested (and vastly different than today’s) then if and when we really do enter a rapidly accelerating “end time” our individual exits would be as decently humane as possible because they would be occurring within a societal death-with-dignity of a society of broad solidarity. I suppose this is kind of glum thinking, but maybe that’s an inevitable result of my growing ‘old’ in these times.

All this has been a rather prolix introduction to a video about climate change I thought you might enjoy. The Age Of Stupid is a 90 minute British documentary from 2009 (five years in the making) that remains brilliantly cogent about the “human element” driving the climate change geophysics, and is also refreshingly accurate about the physical details of that geophysics. [1] The Age Of Stupid Revisited is a 15 minute look back on the original documentary, from today. [2] Nothing has changed for the better; for the worse yes. Reflecting on this documentary, on the arc of my climate change consciousness, and on my belief (which I wish future reality would contradict) that there will never be any significant collective action to stop anthropo-exacerbation of climate change, and to also end poverty and to economically level national and world societies, I arrived at the rather tart characterization that: human life is a sexually transmitted planetary disease, and climate change is the disinfectant that will cure it.

Notes

[1] The Age of Stupid
2009
https://youtu.be/awVbLg59tR8

[2] The Age of Stupid revisited: what’s changed on climate change?
15 March 2019
https://youtu.be/GqHKYwxEIRA

<><><><><><><>

Our Globally Warming Civilization

<><><><><><><><><><><><><><><><><><><><><><><><><><><><><><><><>

Our Globally Warming Civilization

The 150 years of the Industrial Revolution (~1770-1920), with its catastrophic and bloody termination in World War I (1914-1918), had no noticeable effect on the global average temperature, which had hovered around 14.7 degrees Centigrade (C) since antiquity. The human population had taken 200,000 years (more or less) to grow to one billion (1B), in 1804, within the natural and majestic evolution of global climates during those 2000 centuries, (1).

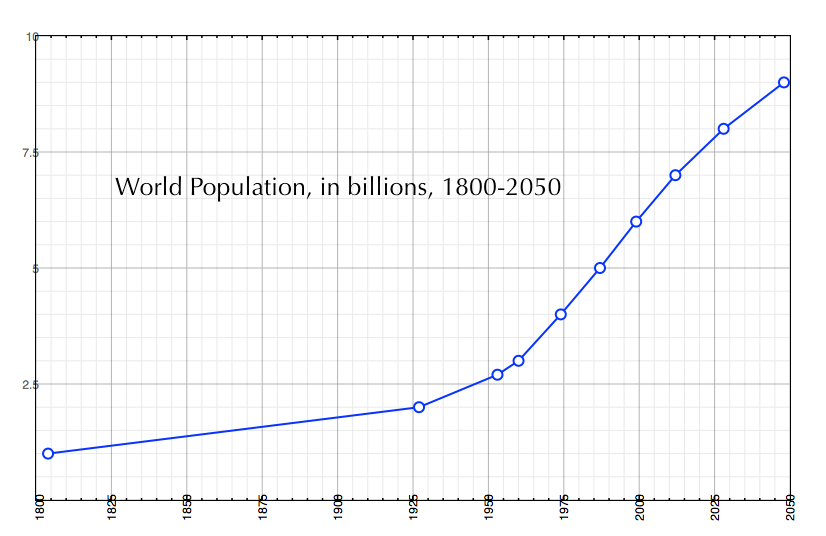
By 1927, the human population had increased to 2B. The 1920s were economic boom years in the Industrialized World (give or take some post WWI German misery, the Russian Revolution, and Chinese civil warfare) with the liquid petroleum replacing the solid coal as the fossil fuel of choice for transportation vehicles; and the explosion in the craving for, and manufacture and use of, internal combustion engines and the automobiles powered by them.

After 1927 the rate of population growth increased from what it had been on average during the previous 123 years (about 8 million per year, ~8M/yr) to an average rate of 29M/yr, to accumulate another 0.7B people in the 26 years up to 1953, when the population was 2.7B. Those 26 years between 1927 and 1953 spanned the crescendo of the Roaring ‘20s, the capitalist economic collapse of 1929, the Great Depression (1929-1942), World War II (1939-1945), the Second Sino-Japanese War (1937-1945), and the Chinese Communist Revolution and Civil War (1946-1949).

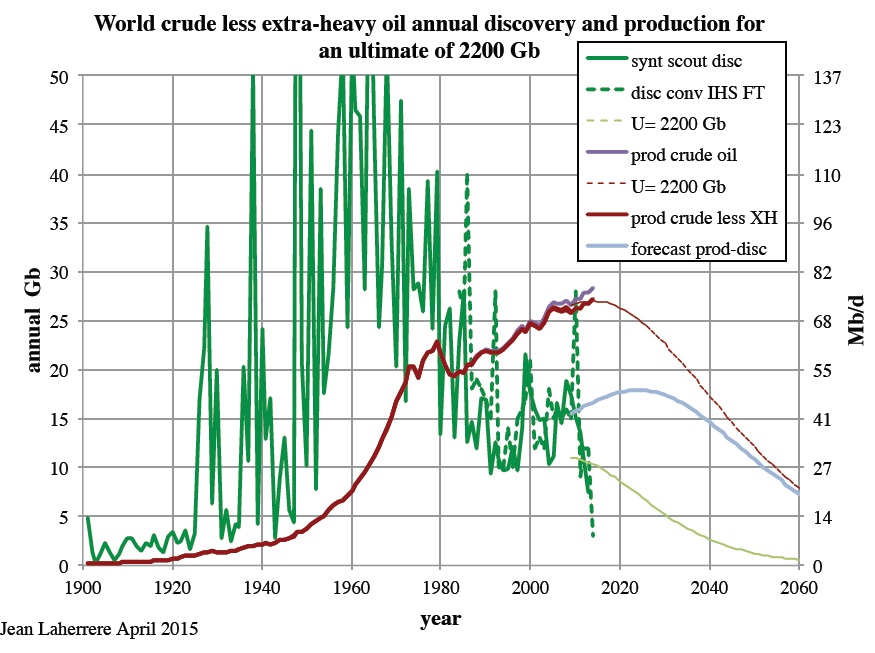
I estimate that the cumulative amount of petroleum produced (pumped out and used up) by 1953 was 98.6 billion barrels (98.6 giga-barrels, 98.6Gb), (2). This implies that since about 1900, when civilization’s use of petroleum as a fuel began in earnest, it consumed 602 giga-GJ (602 x 10^18 Joules) of energy (equivalent to 168 mega-GWh = 168 x 10^9 MWh = 168 giga-mega-watt-hours) to power itself up to 1953, (3).

By 1960, the world’s human population had reached 3B, and the rate of population growth was accelerating (having been about 43M/year during the previous 7 years). From 1960 to the present day, the trend of cumulative production of petroleum, Q, has been proportional to the rising trend of human population, in the ratio of 272 barrels of oil per person (272 b/p).

Specifically, my approximating formula for Q, the accumulated production of oil in giga-barrels (Q, in Gb), given as a function of the population in billions (P, in B) for a given year within the interval 1960 to 2025 is:

Q(year) = [P(year) – 2.7B] x (272 b/p).

This approximation gives an accumulated production up to 2015 (with population 7.35B) of

Q(2015) = 1265Gb, (approximation).

By integrating the actual production rate-per-year curve (the “Hubbert curve” for world production, in GB/yr) given by Laherrere (2), I find the actual accumulated production up to 2015 to be:

Q(2015) = 1258Gb, (actual).

The rate of oil production is now likely at its peak of between 25 Gb/yr to 35 Gb/yr during this 20 year interval between 2005 and 2025, (2),(4). Thereafter, it should drop rapidly since current oil fields have diminishing production, there have been no major oil field discoveries since the 1970s and the frequency of discovery has steadily diminished since then. That means that over half of Earth’s original total reserves, estimated at 2,200Gb (2), have already been extracted. The “end-of-oil” seems destined for the last two decades of the 21st century.

Assuming all that oil was burned, up to the year 2015 (115 years since 1900), civilization would have used 7,674GGJ, (7,674 x 10^18 Joules), equivalent to 2,139GMWh, (2,139 x 10^15 Watt-hours) of energy, derived from that 1258Gb of petroleum, to power itself.

That burning would have released 398,786Gkg (~4 x 10^14 kg = ~400 giga tonnes) of CO2, (5). At present (May 2019) there are about 3,250 giga tonnes of CO2 in the atmosphere, with an average concentration of 415 parts per million by volume (415ppmv), (6). 1228 G tonnes of that CO2 is excess above the pre-industrial amount in the atmosphere. The ~400 G tonnes estimated here as the accumulated emissions from the prior burning of petroleum (up to about 2015) is only about one-third of the excess atmospheric CO2.

There are numerous other processes in our civilization, as well as in the natural world, that cause the emission of carbon-dioxide and its atmospheric retention in excess amounts. The main sources of CO2 emissions are the exhalations from aerobic respiration by all of Earth’s living heterotrophs, decaying plants, and volcanic eruptions. Other sources include: the burning of coal and natural gas, forest and vegetation fires caused naturally and by slash-and-burn agriculture, the bubbling out of CO2 from warming oceans no longer able to dissolve as much of that gas as before, and the massive amount of past and continuing forest clearing that has reduced Earth’s natural system of CO2 uptake — photosynthesis. The cement industry is one of the two largest producers of anthropogenic carbon dioxide, creating up to 5% of worldwide man-made emissions of this gas, of which 50% is from the chemical process and 40% from burning fuel, (7).

Methane (CH4) is a very potent greenhouse gas, being 30 times more effective than CO2 at trapping heat. “For each degree that Earth’s temperature rises, the amount of methane entering the atmosphere from microorganisms dwelling in lake sediment and freshwater wetlands — the primary sources of the gas — will increase several times. As temperatures rise, the relative increase of methane emissions will outpace that of carbon dioxide from these sources.” (8) Other sources of methane emissions are: rotting organic wastes, termite colonies, and bovine flatulence from industrialized agricultural sites. The globally warmed thawing Arctic tundra is now a region of major methane eruptions.

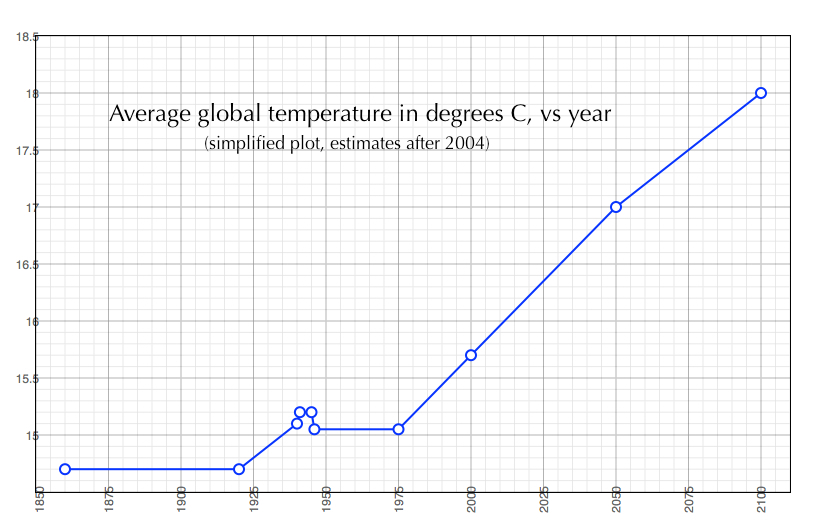
Up until 1974, when the human population had reached 4B, Earth’s climate system had yet to become feverish over the previous 200,000 years of collective human activity. However, at about that time the average global temperature began increasing at a historically unprecedented rate because of civilization’s heated and organic outgassing, a process which continues today as anthropogenic global warming, (9).

In fact, the date at which collective human activity began to affect and alter Earth’s climate system has now been pinpointed to somewhere between October to December 1965. That date marks the end of the Holocene Epoch of geologic history (which began 11,700 years previously, after the last Ice Age), and the beginning of the Anthropocene Epoch — the epoch of human-affected climate, globally. The physical phenomenon marking this transition is that Carbon-14, a radioactive isotope released during open-air atomic and nuclear bomb explosions between 1945 and 1963, had finally dispersed uniformly around the globe, and become absorbed into tree tissues even in the remotest parts of the world, thus recording that uniformity (10).

Between 1960 and 2025, the three rising trends of: population (P), cumulative oil production (Q), and increase of average global temperature above baseline (T – 14.7C = delta-T), are all uniformly proportional to one another.

Specifically (for years between 1960 and 2025) T, P and Q are related to each other as follows:

[T(year) – 14.7C] = [P(year) – 2.7B]/3.3B = [Q(year)/(900 Gb)],

where the forms above are each equivalent to a temperature difference relative to the baseline of 14.7C (delta-T, in degrees C).

Notice that if T = 15.7C, and P = 6B, and Q = 900 Gb, then the equality above holds, with: 1 = 1 = 1. This particular condition actually occurred during 1999.

During this 65 year interval, a 1 degree C rise in temperature (above 14.7C) is coincident with a 3.3B increase in population (above its 1953 level of 2.7B), which in turn is coincident with a production (and use) of 900Gb of petroleum.

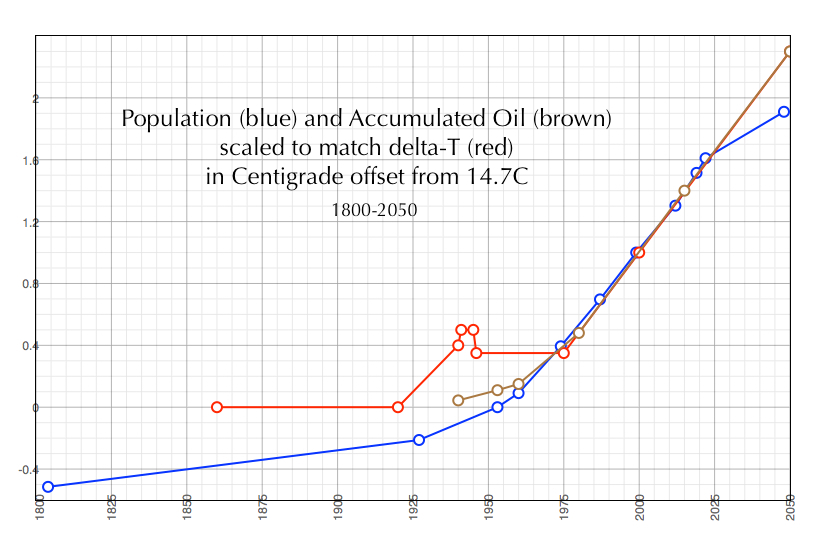
The population is growing from 3B in 1960 to an expected 8B in 2028 during this 68 year interval, with an average population increase of +73.5M/yr. Within these 68 years, and especially during the 55 years from 1970 to 2025, the rising trends of (T – 14.7C), (P – 2.7B)/3.3B, and Q/(900Gb) are in lockstep. This period — with explosive population growth, depletion of over half of the Earth’s petroleum endowment, and with an unprecedented rate of global warming — began in the last year of the Eisenhower Administration, 1960, when John Kennedy was elected US President, and extends right up to the present (and beyond it).

The average global temperature will have climbed up from ~15C to ~16.2C during this interval, a relative rise of 1.4C, and a rise of ~1.5C (delta-T = ~1.5C) above the pre-industrial temperature, defined here as 14.7C (58.46 degrees Fahrenheit). That 1.5C (2.7F) warming above the pre-industrial temperature represents a tremendous amount of heat energy diffused throughout the biosphere, and the deleterious effects of that excess heat are self-evident to all: the altering of climate; the powering of violent weather; the heating and acidifying (with absorbed CO2) of the oceans, sterilizing them of marine life; the melting of glaciers and thawing of tundras; the causing of carbon dioxide and methane to bubble out of solution and frozen capture in the natural world (in a vicious feedback loop); the expansion of disease pathogens and tropical parasites; and the added stresses to both wild and farmed vegetation, and increased desertification, which result in human hunger and desperate migrations of impoverished refugees.

Now, our civilization is starting to suffocate in the lingering heat of its previous exhalations. The singular challenge to our species and to our political economies is what to do, collectively, about global warming. That challenge remains largely unanswered, and tragically denied by too many people .

Notes

1. World population is estimated to have reached one billion for the first time in 1804. It was another 123 years before it reached two billion in 1927, but it took only 33 years to reach three billion in 1960. The global population reached four billion in 1974 (14 years later), five billion in 1987 (13 years later), six billion in 1999 (12 years later), and seven billion in October 2011 (12 years later), according to the United Nations, or in March 2012 (13 years later), according to the United States Census Bureau.
https://en.wikipedia.org/wiki/World_population

World population by year
https://www.worldometers.info/world-population/world-population-by-year/

2. Jean Laherrere, World Crude Oil Production, (brown line), April 2015
https://upload.wikimedia.org/wikipedia/commons/4/46/World_crude_discovery_production_U-2200Gb_LaherrereMar2015.jpg

3. The energy released from combusting 1 barrel of oil is 6.1 giga-joules (6.1 GJ), which equals 1.7 MWh (1.7 mega-watt-hour).
https://en.wikipedia.org/wiki/Barrel_of_oil_equivalent

4. Worldwide, around 92.6 million barrels of oil were produced daily in 2017.
https://www.statista.com/statistics/265203/global-oil-production-since-in-barrels-per-day/
~73 million barrels/day in 1998, rising since.
73 Mb/day = 26.7 Gb/yr (1998)
93 Mb/day = 34.0 Gb/yr (2017)
During 20 years of production (1998-2017) the rate rose 20 Mb/day = +1 MB/day/year

5. Burning one barrel of petroleum can produce between 317kg (realistically) to 433kg (theoretically) of CO2:
Realistic
http://numero57.net/2008/03/20/carbon-dioxide-emissions-per-barrel-of-crude/
Theoretical
https://www.answers.com/Q/How_much_CO2_produced_by_burning_one_barrel_of_oil
Therefore, the CO2 emitted by combusting 1b = 317kg CO2.

6. As of January 2007, the earth’s atmospheric CO2 concentration is about 0.0383% by volume (383 ppmv) or 0.0582% by weight. This represents about 2.996×10^12 tonnes (1 tonne = 1000kg), and is estimated to be 105 ppm (37.77%) above the pre-industrial average (~278 ppmv).
https://micpohling.wordpress.com/2007/03/30/math-how-much-co2-by-weight-in-the-atmosphere/

415 ppmv of atmospheric CO2, as of May 2019
https://en.wikipedia.org/wiki/Carbon_dioxide_in_Earth%27s_atmosphere

Therefore:
(415/383) x 3000 G tonnes = 3,250 G tonnes, (May 2019).

7. Environmental impact of concrete
https://en.wikipedia.org/wiki/Environmental_impact_of_concrete

8. Methane is roughly 30 times more potent than CO2 as a heat-trapping gas
https://www.sciencedaily.com/releases/2014/03/140327111724.htm

9. I first constructed the simplified plot of average global temperature in 2004, using data from public sources. Details about that construction and the data used are given at:
Population, Oil and Global Warming, 31 May 2019 (15 March 2004)
https://manuelgarciajr.com/2019/05/31/population-oil-and-global-warming/

10. The Anthropocene Epoch began sometime between October and December 1965.
https://manuelgarciajr.com/2018/02/23/the-anthropocenes-birthday/

<><><><><><><>

The Anthropocene’s Birthday

The Anthropocene’s Birthday, or the birthyear of human-accelerated climate change.

Scientists have found a major spike in the amount of Carbon-14 within the tree rings of “The Loneliest Tree In The World,” which ring corresponds to October-December 1965.

This tree is a Sitka Spruce, a species from the American Northwest (and into Canada) that was planted on Campbell Island in 1901 (or 1905), which island is in the Southern Ocean about 400 miles south of the southern tip of New Zealand.

There are no other trees on Campbell Island, just low scrubs. Since the next landmass south of Campbell Island is Antarctica, this tree is the furthest one south on Earth (so far as I can tell). The next closest tree is north about 170 miles, on another small island south of New Zealand.

The significance of this finding is that geologists now know that the start of the Anthropocene – which is the geological Epoch (after the Holocene Epoch) when GLOBAL (not just local) climate is clearly being influenced by human activity and at an accelerating rate – began in 1965. The Holocene Epoch occurred from -11,700 to 1965.

The Carbon-14 marker is from the radioactive fallout from atmospheric nuclear bomb testing, which grew from 1945 and peaked in 1962, after which it stopped in 1963 as a result of the Test Ban treaty of that year (except for a few isolated atmospheric tests since).

The accumulated radioactive fallout from the massive testing of the 1950s and early 1960s (with a huge amount in 1962) had finally spread out uniformly through the global atmosphere, and the Carbon-14 from that fallout was being infused into trees globally through the process of photosynthesis.

So, this spike in tree-ring Carbon-14 in 1965 is a GLOBAL marker of human activity on global climate, and thus marks the ‘birthday’ of human-induced/accelerated Climate Change.

Coring “the loneliest tree in the world”
https://youtu.be/954fZW9F3tQ

The geophysical transition of 1965, noted above, was imperceptible to the human senses, but it is a very significant event/transition in the history of Planet Earth.

You should easily be able to find internet sources giving all the scientific details including charts/graphs of the actual Carbon-14 signature (of the subject tree) over time, which clearly displays the spike during 1965. This same spike was found in trees sampled in the Northern Hemisphere as well, and since there was the same marker on trees globally – for the first time – it was clear the spike indicated a uniformly global effect. And that effect was caused by humans. Hence, the birth of the Anthropocene.

Geologists are now updating their table of geological supereon-eon-era-period-epoch-age, and all textbooks will have to be updated. The last Epoch (the Holocene) of the Quaternary Period extended from 11,700 years ago, when the last glacial retreat was clearly accelerating and the Ice Ages were over, and 1965 when humanity now had leverage on the global climate: the Anthropocene.

When will the next Epoch begin, and how will it be determined (and will there be any ‘who’ to do so)?

<><><><><><><>

The part of this posting down to and including the weblink to the tree coring video were published online at Counterpunch, see below.

The Anthropocene’s Birthday, or the Birth-Year of Human-Accelerated Climate Change
22 February 2018
by Manuel García, Jr.
https://www.counterpunch.org/2018/02/22/the-anthropocenes-birthday-or-the-birth-year-of-human-accelerated-climate-change/

<><><><><><><>