Global Warming and Ocean Acidification Accelerate

The global warming of the biosphere and its consequent acidification of the oceans is a complex of geophysical, biological and ecological, and sociological phenomena that are all accelerating. There is much that humanity could do to slow that acceleration, and to enact strategies for its own protection from Nature’s escalating assaults on civilization by the grand feedback loop of anthropogenic global warming climate change, but there is really nothing humanity can do to stop it.

Carbon Dioxide Emissions

The anthropogenic emission of carbon dioxide (CO2) — the exhaust fume of economic activity — has increased steadily over the last 270 years, and explosively so for the last 70 years.

Those emissions were 5.28 billion metric tons of CO2 (1 metric ton = 1 tonne = 1000kg = 2,205 lb) in 1950, and 36.15 billion tonnes in 2017 (1 billion tonnes = 1 giga-tonne = 1 Gt). A rough quantitative characterization (analytical fit) to the historical trend of anthropogenic CO2 emissions since the early 20th century is

E = 35.5•[(YEAR-1890)/130]^2, in Gt/year.

The cumulative emissions up to 2017 were 1,540Gt of CO2 (=1.54 trillion tonnes).

Carbon Dioxide in the Oceans

Of the annual CO2 emissions, about 30% are absorbed by the oceans. [1]

A rough quantitative characterization to the historical trend of CO2 absorption by the oceans is

W = 10.4•[(YEAR-1890)/130]^2, in Gt/year.

The cumulative load of anthropogenic CO2 absorbed by the oceans is 450Gt. [2]

According to [3] there are 39,000Gt of carbon currently in the oceans. Since CO2 molecules are 3.667x more massive (‘heavier’) than pure carbon atoms, this represents 143,000Gt of absorbed CO2. The cumulative mass of Earth’s oceans is 1.366GGt (=1.366•10^9 Gt). Thus, the currently absorbed CO2 is in a mass ratio to seawater of 104.7ppmm (=104.7 parts per million by mass). The “ancient” seas (without the 450Gt anthropogenic load of CO2) had 104.4ppmm of CO2.

This seemingly small addition to the CO2 in the oceans has had profound biological and ecological effects, because of the increase of oceanic acidity by 26%. [1], [4] The chemical indicator of acidity used by scientists, pH, has dropped from 8.2 for “ancient” seawater, to 8.1 for present seawater. The pH scale is logarithmic, and its numbers decrease as the solution in question becomes more acidic.

Ocean acidity impedes the ability of shell-forming marine life to produce their protective coverings. With increased ocean acidity, even the shell structures in existence are eroded. These effects make it more difficult for shell-forming marine life to survive, and as many of these life-forms are small (part of the plankton) they are essential foods at the base of the marine food chain. So the ultimate concern about escalating oceanic acidity is the potential for a collapse of marine life. One estimate of the CO2 concentration needed for “ocean death” by acidification is 400ppmm to 500ppmm. [3]

This implies that 400,000Gt to 540,000Gt more of CO2 would have to be deposited into the oceans; a task that would require 38,000 years to 52,000 years of anthropogenic emissions at the current rate (10.4Gt/year into the oceans). However, “ocean dying” is plainly evident with the current quantity of absorbed CO2, and it will only get worse at an accelerating pace as more CO2 is emitted by civilization.

The chemistry of ocean acidification is as follows. [1]

CO2 + H2O + CO3 —> 2HCO3

Carbon dioxide plus water plus a carbonate ion react to form 2 bicarbonate ions. This process occurs in three steps:

CO2 + H2O —> H2CO3

Carbon dioxide plus water form carbonic acid, which is a weakly bound molecule.

H2CO3 —> H(+) + HCO3(-)

Carbonic acid breaks up into a hydrogen ion and a bicarbonate ion.

H(+) + CO3(2-) —> HCO3(-)

The hydrogen ions liberated in the previous reaction find carbonate ions floating in seawater, and combine into bicarbonate ions. The net result is two bicarbonate ions in the seawater solution.

Shell-forming marine life capture carbonate ions, CO3(2-), to combine them with calcium into calcium carbonate, CaCO3, to form their pearls and seashells. Extracting the needed carbonate by breaking apart bicarbonate ions, instead of just collecting free-floating carbonate ions, is more energy intensive and thus a frustration of the shell-forming biology of so much marine life. So, ocean acidification by CO2 removes some of the stores of a formally available free-floating carbonate ions from the reach of shell-forming marine life.

That acidity, a function of the liberated hydrogen ions, H(+), can also dissolve existing shells. [5]

CaCO3 + 2H(+) —> Ca(2+) + CO2 + H2O

Calcium carbonate (shells) plus hydrogen ions react, dissolving the shell, into free-floating calcium ions plus absorbed carbon dioxide gas plus water.

The Rate of Global Warming is Accelerating

From what has been described up to this point, in conjunction with my previous modeling, I calculate the following tabulated results.

Note that the rate at which global temperature is increasing is accelerating, as is the rate of global warming (the Watts absorbed by the biosphere each year). Also note that entries after 2020 are necessarily projections, and are based on the assumption of existing trends (and the analytical formulas fitted to them) continuing. The entries listed for the year 2020 are pointed out to show that earlier entries are backed by data, and later entries are projections; and to note that rate of global warming for any year listed is shown as a ratio to its rate for year 2020.

The Rate of Ocean Acidification is Accelerating

From what has been described up to this point, I calculate the following tabulated results.

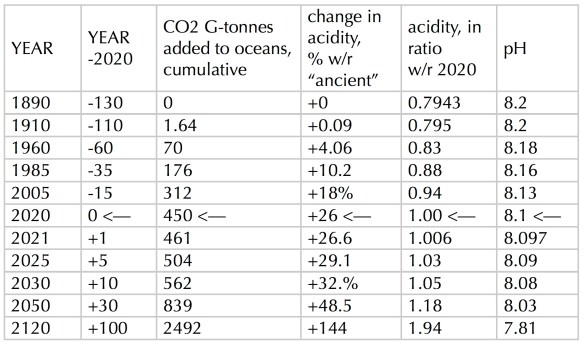
As in the first table, entries up to year 2020 are backed by data, while those after year 2020 are projections. Today’s oceans are 26% more acidic than the oceans of the late 19th century. An alternative comparison is that the oceans of the late 19th century were only 79% as acidic as they are today. If the current trend — of annually increasing anthropogenic CO2 emissions — continues to the end of the 21st century, then the oceans would be 144% (2.44x) more acidic than in the late 19th century; or, equivalently, almost twice as acidic as they are today. Those future acidic oceans at pH=7.8 would reproduce conditions during the middle Miocene, 14 to 17 million years ago, when the Earth was several degrees warmer and a major extinction event was occurring. [1], [4]

“Fixing” Global Warming

I see no possibility of a technical “miracle” to fix global warming; something like an anti-global-warming planetary vaccine, making civilization safe to continue with capitalism.

The CO2 in the biosphere is an extremely dilute mass within enormous masses and expanses of air and water. Removing the anthropogenic excesses of CO2 from the air and the oceans would require the filtration of an immense bulk of matter. Processes of such filtration would require immense quantities of energy, to pump and chemically “strain.” Even if we were able to generate sufficient quantities of energy to power such processes, I cannot imagine that generation to be free of CO2 emissions that would exceed whatever quantity of CO2 was strained out of the biosphere. So, I see such ideas of “technical fixes” as fantasies of the perpetual motion machine variety, and obviated by the 2nd Law of Thermodynamics (specifically, as it applies to reversing the process of diffusion).

The only lever I see humanity having with which to influence the pace of global warming is the degree of its restraint in emitting CO2 in the first place. There is no more energy-efficient counter-warming strategy we can devise. The most effective protective armor that can be devised to shield people from the potential harm that playing Russian Roulette can inflict is to not shoot themselves in the head in the first place.

The energy that we do generate and use to counteract the negative effects of global warming (not just to humans, but to thousands of other species) is best spent in transforming our societies and civilization for maximal mutual assistance and solidarity, and minimal competitive tribalism. Some of that energy would go into physical constructions to shield people from floods, inundation, excessive heat and drought; and some of that energy would go into civic arrangements for sheltering, feeding, healthcare and economic stability of all individuals, and the resettlement of those displaced by loss of habitat: by the loss of coastal land to the rising of sea level, and the loss of living space in continental interiors because of the onset of unlivable heat and loss of water.

Essential to the energy efficiency of both devising and implementing such counter-warming social transformations, it is necessary to stop wasting energy on activities without intrinsic social benefits. Specifically, we, worldwide — but most especially among the 10% wealthiest of Earth’s people, who produce 49% of anthropogenic CO2 emissions [6] — need to abandon every trace of profligate CO2-spewing lifestyles enabled by competitive and exclusionary capitalism and its plethora of bigotries, to instead join cooperatively in World Socialism without consumerist economics nor tribal animosities.

Planet Earth is the loveliest jewel we know of in the entire Universe. If we treated it as such, and each other as part of the sparkle of that gem, we would experience lives in an actual Paradise, regardless of how challenging global warming made our existence.

Notes

[1] Ocean Acidification
https://www.noaa.gov/education/resource-collections/ocean-coasts/ocean-acidification

[2] Cumulative anthropogenic CO2 absorbed by oceans is 450Gt
Previously, I showed that 1,090Gt of CO2 currently resides in the atmosphere; thus 1,540Gt – 1,090Gt = 450Gt. [450Gt/1,540Gt]•100% = 29.2%.

[3] Ocean storage of carbon dioxide
https://en.wikipedia.org/wiki/Ocean_storage_of_carbon_dioxide

[4] A primer on pH
https://pmel.noaa.gov/co2/story/A+primer+on+pH

[5] Calcium carbonate
https://en.wikipedia.org/wiki/Calcium_carbonate

[6] Image: Percentage of CO2 emissions by world population, was produced by OXFAM.

<><><><><><><>

One Year of Global Warming Reports by MG,Jr

<><><><><><><><><><><><><><><><><><><><><><><><><><><><><><><><>

One Year of Global Warming Reports by MG,Jr

Over the last year, I have posted a series of reports on global warming climate change that address it in a quantitative physics, rather than qualitative and sociological manner. Those reports are listed below in chronological order. My estimation of what global warming “will look like” in the immediate and longer term future was refined over the course of producing these reports; but they are all of-a-piece on the topic.

The first report is primarily “data” for subsequent calculations (and very important). The two PDF reports are my mathematical physics notes on my calculations (the first of these being most significant). The other five are applications of the numerical results for descriptive purposes — to help the general reader understand the magnitude and duration of the global warming effect.

A number of these reports found their way onto Internet Magazines, most significantly Counterpunch, and Green Social Thought.

The versions on my blog have had minor numerical and/or typographical errors corrected (as I find them), and are followed by my comments of subsequent thoughts, with more physics on them just after they were posted.

My sociological recommendations about “what to do about climate change” are summarized in one brief paragraph at the end of Biosphere Warming in Numbers.

My purpose in doing this work should be obvious; first, for me to understand, quantitatively, the nature of global warming; and, secondly, to help “you” to understand it.

I welcome comments and questions on the topic; after all it was such inquiries that prompted me to look into this topic (scientifically) more deeply in the first place.

Please also note, I do NOT dispute the work of professional geophysics/climate change scientists, who work at climate change institutes of various kinds around the world (e.g., meteorological, geological, atmospheric physics and chemistry, oceanographic, biological/ecological/evolutionary sciences), and who use banks of supercomputers to model the many complexities of global warming and climate change (with numerous such complexities still beyond current science’s grasp).

Ye Cannot Swerve Me: Moby-Dick and Climate Change
15 July 2019
https://manuelgarciajr.com/2019/07/15/ye-cannot-swerve-me-moby-dick-and-climate-change/

A Simple Model of Global Warming
26 May 2020
https://manuelgarciajr.files.wordpress.com/2020/05/global-warming-model.pdf

Global Warming is Nuclear War
28 May 2020
https://manuelgarciajr.com/2020/05/28/global-warming-is-nuclear-war/

Living With Global Warming
13 June 2020
https://manuelgarciajr.com/2020/06/13/living-with-global-warming/

No emissions with exponential decay of CO2 concentration: Model
18 June 2020
https://manuelgarciajr.files.wordpress.com/2020/06/global-warming-co2-shutoff.pdf

Global Warming and Cooling After CO2 Shutoff at +1.5°C
20 June 2020
https://manuelgarciajr.com/2020/06/20/global-warming-and-cooling-after-co2-shutoff-at-1-5c/

Biosphere Warming in Numbers
3 July 2020
https://manuelgarciajr.com/2020/07/03/biosphere-warming-in-numbers/

Carbon Dioxide Uptake by Vegetation After Emissions Shutoff “Now”
8 July 2020
https://manuelgarciajr.com/2020/07/08/carbon-dioxide-uptake-by-vegetation-after-emissions-shutoff-now/

<><><><><><><>

ALSO:

Global Warming and Ocean Acidification Accelerate
18 July2020
https://manuelgarciajr.com/2020/07/18/global-warming-and-ocean-acidification-accelerate/

Ocean Heat, From the Tropics to the Poles
1 August 2020
https://manuelgarciajr.com/2020/08/01/ocean-heat-from-the-tropics-to-the-poles/

The Improbability of CO2 Removal from the Atmosphere
9 August 2020
https://manuelgarciajr.com/2020/08/09/the-improbability-of-co2-removal-from-the-atmosphere/

ClimateSIM Junior, Simplified Prognostication from Unrealistic Hypothesis
16 August 2020
https://manuelgarciajr.com/2020/08/16/climatesim-junior-simplified-prognostication-from-unrealistic-hypothesis/

Facing Extinction, My View
2 September 2020
https://manuelgarciajr.com/2020/09/02/facing-extinction-my-view/

<><><><><><><>

Possible Future Trends of CO2 Concentration and Global Temperature
7 September 2020 (revised 9 September 2020)
https://manuelgarciajr.com/2020/09/07/possible-future-trends-of-co2-concentration-and-global-temperature/

The above (a brief summary) includes a web-link to the big report below.

A Rate Equation for Accumulation or Loss of Atmospheric CO2
5 September 2020 (revised 9 September 2020)
https://manuelgarciajr.files.wordpress.com/2020/09/rate-equation-for-atmospheric-co2-revised.pdf

<><><><><><><>

Major improvement on the above

Anthropogenic CO2 Emissions Are Fate
12 September 2020
https://manuelgarciajr.com/2020/09/12/anthropogenic-co2-emissions-are-fate/

For those interested in the technicalities, see

A Carbon Balance Model of Atmospheric CO2
11 September 2020
https://manuelgarciajr.files.wordpress.com/2020/09/a-carbon-balance-model-of-atmospheric-co2.pdf

<><><><><><><>

Reducing CO2 Emissions to Reverse Global Warming
17 September 2020
https://manuelgarciajr.com/2020/09/17/reducing-co2-emissions-to-reverse-global-warming/

Global Warming Burps, Bubbles, Simmers and Sours On
24 September 2020
https://www.counterpunch.org/2020/09/24/global-warming-burps-bubbles-simmers-and-sours-on/

Another Model of Atmospheric CO2 Accumulation
5 October 2020
https://manuelgarciajr.com/2020/10/05/another-model-of-atmospheric-co2-accumulation/

The CO2 and Temperature of the PETM
2 November 2020
https://manuelgarciajr.com/2020/11/02/the-co2-and-temperature-of-the-petm/

<><><><><><><>

Carbon Dioxide Uptake by Vegetation After Emissions Shutoff “Now”

If all carbon dioxide emissions were immediately and permanently shut off in the year 2020 (with 417ppm of CO2 presently in the atmosphere), when would the natural uptake of CO2 by Earth’s vegetation (primarily, at first) bring the CO2 concentration down to its “ancient” level of 280ppm?; and when would the average global surface temperature return to its 1910 level (the “ancient” level, with 0°C of global warming)?

By a series of inferences based on my previous calculations of global warming, I estimate that the answers to the above questions are:

1,354 years to reach 280ppm (after an abrupt CO2 shutoff in 2020);

even so, the global temperature will rise another +2.75°C by 300 years (year 2320), remain there for a century (till year 2420), then slowly reduce to the point of 0°C of global warming (the temperature in 1910, used as my baseline for “ancient” pre-warming conditions) in the year 3374.

Figure 1, below, summarizes these findings.

FIGURE 1: CO2ppm/100 and Relative Temperature after 2020 shutoff

What follows is an explanation of how I arrived at these conclusions. It is an exercise of inductive reasoning that I present in a detailed manner for the benefit of the reader’s understanding of my logic, and to give the reader every opportunity to challenge the arguments I advance.

I proceed by making inferences from incomplete data at my disposal, linked as necessary by physical assumptions that are clearly stated, to eventually arrive at projected histories of CO2 concentration in the atmosphere, and the relative temperature (with respect to that of 1910), for the 1,354 years between 2020 and 3374.

Data on Earth’s Biomass

Humanity today comprises only 0.01% of all life on Planet Earth, but over the course of human history our species has destroyed 83% of wild mammal species. [1]

The world’s 7.6 billion people [in May 2018] represent just 0.01% of all living things. Yet since the dawn of civilization, humanity has caused the loss of 83% of all wild mammals and half of plants, while livestock kept by humans abounds. The new work cited is the first comprehensive estimate of the weight of every class of living creature and overturns some long-held assumptions. Bacteria are indeed a major life form – 13% of everything – but plants overshadow everything, representing 82% of all living matter. All other creatures, from insects to fungi, to fish and animals, make up just 5% of the world’s biomass. Farmed poultry today makes up 70% of all birds on the planet, with just 30% being wild. The picture is even more stark for mammals – 60% of all mammals on Earth are livestock, mostly cattle and pigs, 36% are human and just 4% are wild animals. Where is all that life to be found?: 86% on land, 1% in the oceans, and 13% as deep subsurface bacteria. [2]

I assume that “today” 7.7 billion humans are 0.01% of Earth’s biomass, and that the “average” human weighs 65 kilograms (kg), which is equivalent to 143.4 pounds (lb).

From this, the mass of humanity is estimated to be 5.0×10^11 kg, and the totality of biomass is estimated to be 5.0×10^15 kg.

The estimated totality of biomass can also be stated as 5,000 giga-metric-tons. A metric ton (tonne) is equivalent to 1,000 kg.

The following table lists the quantitative estimates made from the data (above) regarding the Earth’s biomass (the NOTES column in the table indicate assumptions made). Yes, there are gaps and imperfections in the table, which reflect the incomplete knowledge I begin with.

Mass of CO2 in the Atmosphere

The mass of Earth’s atmosphere is 5.2×10^18 kg.

To a good approximation, Earth’s atmosphere is made up of diatomic nitrogen (N2), at 79%, and diatomic oxygen (O2) at 21%. The molecular weight of an N2 molecule is 28 (atomic mass units); and the molecular weight of an O2 molecule is 32 (atomic mass units). A conceptual “air” molecule is defined as having a molecular weight that is 79% that of N2 plus 21% that of O2; that value is 28.8 atomic mass units (AMU).

A carbon dioxide molecule has a molecular weight of 44 atomic mass units (the carbon atom contributes 12 AMU, the two oxygen atoms contribute 32 AMU, combined). So, a CO2 molecule is 1.526x heavier than an “air” molecule.

The concentration of CO2 in the “ancient” atmosphere was 280ppmv (parts per million by volume). The mass (weight) of that ancient (original or baseline) quantity of atmospheric CO2 is thus:

(280ppmv) x (5.2×10^18 kg) x (1.525) = 2.22×10^15 kg.

The mass (weight) of the CO2 presently in the atmosphere (417ppmv) is estimated by a simple ratio:

(417ppm/280ppm) x 2.22×10^15 kg = 3.31×10^15 kg.

The difference between the masses of CO2 today, and in the “ancient” (pre 1910) atmosphere, is the “excess” CO2 driving global warming. The quantity is:

(3.31×10^15 kg) – (2.22×10^15 kg) = 1.09×10^15 kg.

That is 1,090 giga-tonnes.

A second route to estimating the mass of CO2 in the atmosphere is as follows.

Modeling of the huge CO2 spike that occurred 55.5 million years ago and that produced the Paleocene-Eocene Thermal Maximum (PETM) was described in [2], drawing on work cited in [3] and [4].

5,000 billion tonnes of carbon were quickly injected into the model atmosphere, producing a concentration of 2,500ppmv of CO2. The modeling showed the excess CO2 being cleared from the atmosphere by a variety of processes, down to a level of about 280ppmv by 200,000 years.

I interpreted the statements about this modeling, in both [3] and [4], to mean that 5,000 billion metric tonnes of carbon (which happened to be bound in carbon dioxide molecules) — but not 5,000 gigatons carbon dioxide — were injected into the model atmosphere.

The ratio of the molecular weight of carbon dioxide, to the atomic weight of carbon is 44/12 = 3.667.

The quantity of injected CO2 (2,500ppmv) in that model is then:

(3.667) x (5,000×10^9 tonnes) x (1,000 kg/tonne) = 1.834×10^16 kg.

By simple ratios I estimate the masses of CO2 at both 280ppmv and 417ppmv:

(280ppmv/2500ppmv) x (1.834×10^16 kg) = 2.05×10^15 kg,

(417ppmv/2500ppmv) x (1.834×10^16 kg) = 3.06×10^15 kg.

Note that by the first method of estimating these masses I arrived at:

2.22×10^15 kg, at 280ppmv,

3.31×10^15 kg, at 417ppmv.

The agreement between the two methods is heartening. So, continue.

Notice that the mass of CO2 per ppm is:

1.834×10^16kg/2500ppm = 7.34×10^12kg/ppm; equivalently 7.34giga-tonne/ppm.

Lifetime of CO2 in the Atmosphere

The modeling of the PETM described in [2], [3] and [4] showed that after about 10,000 years after the “quick” CO2 injection, the concentration had been reduced to about 30% of its peak level, so to about 750ppm.

This means that the mass of atmospheric CO2 was reduced by 12,840 giga-tonnes (from 18,340 giga-tonnes to 5,500 giga-tonnes) over the course of 10,000 years.

Assuming that this reduction occurred at a uniform rate (linearly) implies that the rate was -1.284 giga-tonne/year, or -1.284×10^12 kg/yr.

The Earth during the PETM (55.5 million years ago) and the Eocene (between 56 and 35 million years ago) was ice-free. The Arctic was a swamp with ferns, Redwood trees and crocodiles; and the Antarctic was a tropical jungle. The quantity of vegetation over the surface of the Earth must certainly have been at a maximum.

Roughly half of the CO2 injected into the model of the PETM atmosphere (mentioned earlier) was drawn out by a combination of photosynthesis, uptake by the oceans, and some dissolution of seafloor sediments (chalk deposits), by 1,000 years. About 30% remained at 10,000 years, and that was further reduced (to about 280ppm, or 11% of the 2,500ppm peak) by 200,000 years by the processes of weathering of carbonate rocks, and then silicate rocks.

If the linear reduction rate of -1.284 giga-tonnes/year (estimated for the first 10,000 years of CO2 reduction during the PETM) were operative for the next millennia or two, the excess 1,090 giga-tonnes of CO2 presently in the atmosphere could be cleared down to 280ppm within:

(1,090 giga-tonnes)/(1.284 giga-tonne/year) = 849 years.

However, since 13 million years ago Antarctica has been in a deep deep freeze; and the Arctic has also been a region of deep cold, ice, and minimal vegetation. Also, “since the dawn of civilisation, humanity has caused the loss of 83% of all wild mammals and half of plants.” [1]

So this combination of natural and anthropogenic reductions of Earth’s vegetation from it’s peak during the Eocene would mean that the process of extracting CO2 from the atmosphere by photosynthesis will be slower. For the moment, I assume at half the rate given earlier, or -0.642 giga-tonnes/year. At that rate, clearing the current CO2 excess (linearly) would take 1,698 years.

In [5] I described my model of how average global surface temperature can be influenced by the exponential decay of CO2 in the atmosphere, after an abrupt and permanent cessation of CO2 emissions. I call the time constant (parameter) used in the exponential function that models the longevity of CO2 in the atmosphere, it’s “lifetime.” In [5], I showed a number of post-shutoff temperature histories, each characterized by a specific value of the lifetime parameter, which in mathematical jargon is called the “e-folding time.” The exponential function is reduced to 36.79% of its peak value when the elapsed time is equal to the e-folding time (e^-1).

The case of the e-folding time being 10,000 years (in my model) has the excess CO2 cleared out of the atmosphere by 1,300 years after the abrupt shutoff of emissions (when global warming is at +1°C, as it is now). That “10,000 year case” is shown in Figure 3 of reference [5], and will be described further below.

It also happens that 10,000 years was found to be the time span required to reduce the CO2 concentration in the model PETM atmosphere to about 30% to 40% of its beginning peak value.

So, I infer that 10,000 years is a reasonable estimate of the lifetime parameter (e-folding time) for CO2 in the atmosphere, and that the present excess of CO2 in the atmosphere (417ppm – 280ppm = 137ppm) would be cleared — if there were an immediate and permanent cessation of emissions — within about 1,300 years, which is similar (in this speculative modeling) to the 1,698 years clearing time gotten by halving an estimated clearing rate during the PETM, above.

A linear rate of decrease of 137ppm over 1,300 years would be -0.11ppm/year (this number will be further refined below).

Reduction of excess CO2 concentration after Abrupt Shutoff
(given a 10,000 year e-folding parameter)

Using the “10,000 year case” post-shutoff temperature change history, just noted [5], the following is observed:

The global temperature relative to “now” (2020, at +1°C) is:

above +2.75°C, at 300 to 400 years (net >3.75°C),
above +2.4°C, at 212 to 550 years (net >3.4°C),
above +1.6°C, at 110 to 766 years (net >2.6°C),
above +1.0°C, at 55 to 900 years (net >2°C),
above +0.5°C, at 30 to 1,100 years (net >1.5°C),
above +0°C, at 0 to 1,100 years (net >1°C).

200 years after the temperature overshoot dips below +0°C (below the 1°C of global warming above “ancient” we have now), further cooling returns the global temperature to its level in 1910 (“ancient,” as used here). This is the behavior, over a span of 1,300 years, of the “10,000 year case” calculated in reference [5].

So, I assume that a CO2 “lifetime” of 10,000 years (e-folding time parameter) would result in a reduction of the atmospheric concentration of CO2 from 417ppm (“now”) to 280ppm (“ancient”) in about 1,300 years. That would be a 32.8% reduction of concentration down to a level of 67.2% of the present peak; a linear rate of decrease of 137ppm/1,300years = 0.105ppm/yr (this number will be further refined, below).

Earlier (above) I had found that the mass of CO2 per ppm is:

7.34×10^12kg/ppm, equivalently 7.34giga-tonne/ppm.

If so, then the weight of CO2 removed per year (at -0.105ppm/yr) is:

7.71×10^11kg/yr, equivalently 0.771 giga-tonnes/yr.

The present excess of CO2 is 1,090 giga-tonnes. Clearing it in 1,300 years would imply a uniform (linear) removal rate of 0.839 giga-tonnes/yr.

I will average the two estimates just given for the CO2 removal rate, to settle on:

0.805 giga-tonnes/yr = 8.05×10^11kg/yr

as the CO2 removal rate.

Earlier (above) I found the mass of the present excess of CO2 in the atmosphere to be 1,090 giga-tonnes. It would take 1,354 years to clear away that excess, given a uniform removal rate of 0.805 giga-tonnes/yr.

That reduction of 137ppm over 1,354 years implies a uniform rate of -0.1012ppm/yr.

Earlier (above) I found the total mass of Earth’s plants to be 4,100 giga-tonnes, equivalently 4.10×10^15 kg. The present excess of atmospheric CO2 (1,090 giga-tonnes) is equivalent to 26.6% of the present cumulative mass of all of Earth’s vegetation (plants). The uptake per year is equivalent to 0.0196% of the current total mass of Earth’s plants.

CO2 uptake occurs within the continuing carbon cycle of:

– carbon dioxide absorbed by plant photosynthesis,

– plants consumed as food by animals (heterotrophs),

– organic solids and wastes absorbed by the soil (decay, nutrients, peat, oil, coal),

– carbon dioxide absorbed by the oceans and used to make shells and corals,

– organic gases emitted to the atmosphere (like methane, CH4, which is soon oxidized to CO2 and water vapor),

– re-release of plant-bound carbon to the atmosphere by wildfires,

– mineralization of CO2 by the weathering of carbonate, and then silicate rocks

From “final” quantities and rates determined in all the above, the following projected histories of the reduction of CO2 concentration (in ppm), and global warming (average global temperature excursion above its level in 1910), after an abrupt cessation of CO2 emissions “now,” are determined and tabulated. This is my estimation of the 1,464 year global warming blip projected to occur between 1910 and 3374.


Figure 1, at the top of this report, is a graph of this table.

It is important to note that the conclusions of inductive reasoning — as is the case with this exercise — are viewed as supplying some evidence for the truth of the conclusion. They are not definitive as is the case with proofs by deductive reasoning.

In other words, I did the best I could with what I have. Only the unrolling of the future can supply us the definitive answers.

Notes

[1] Humans just 0.01% of all life but have destroyed 83% of wild mammals – study
https://www.theguardian.com/environment/2018/may/21/human-race-just-001-of-all-life-but-has-destroyed-over-80-of-wild-mammals-study

[2] Ye Cannot Swerve Me: Moby-Dick and Climate Change
15 July 2019
https://manuelgarciajr.com/2019/07/15/ye-cannot-swerve-me-moby-dick-and-climate-change/

[3] Global Warming 56 Million Years Ago, and What it Means For Us
30 January 2014
Dr. Scott Wing, Curator of Fossil Plants,
Smithsonian Museum of Natural History
Washington, DC
[1:44:12]
https://youtu.be/81Zb0pJa3Hg

[4] CO2 “lifetime” in the atmosphere
National Research Council 2011. Understanding Earth’s Deep Past: Lessons for Our Climate Future. Washington, DC: The National Academies Press.
Figure 3.5, page 93 of the PDF file, page numbered 78 in the text.
https://doi.org/10.17226/13111

[5] Global Warming and Cooling After CO2 Shutoff at +1.5°C
20 June 2020
https://manuelgarciajr.com/2020/06/20/global-warming-and-cooling-after-co2-shutoff-at-1-5c/

<><><><><><><>


Biosphere Warming in Numbers

<><><><><><><><><><><><><><><><><><><><><><><><><><><><><><><><>

Biosphere Warming in Numbers

At this time, the Biosphere is warming at a rate of 3.03×10^15 Watts, which is equivalent to a temperature rate-of-rise of 0.0167°C/year. The warming rate has been increasing steadily since the 19th century, when it was on average “zero” except for natural fluctuations (plus and minus) that were hundreds of times smaller than today’s warming rate.

The total energy use by the United States in 2019 was 100 quadrillion BTU (British Thermal Units), which is equivalent to 1.055×10^20 Joules. Averaged out over the 31,557,600 seconds in a year implies a use rate of 3.34×10^12 Watts during 2019.

From the above two observations, we can deduce that the current rate of Biosphere warming on a yearly basis is equivalent to the yearly energy use in 2019 of 907 United States of Americas.

The total increase in the heat energy of the Biosphere since 1910 is 5.725×10^24 Joules, with a corresponding increase of its temperature by 1°C. That heat energy increase over the last 110 years is equivalent to 54,260 years of U.S. energy use at its 2019 amount, per year.

So, today the Biosphere is warming at a rate equivalent to it absorbing the total energy used by the U.S. in 2019, every 9 hours and 40 minutes.

In 2008, I estimated the energy of a large hurricane to be 6.944×10^17Joules. [1] Thus, 152 such hurricanes amount to the same total energy as that used by the U.S. during 2019.

The heat energy increase of the Biosphere during 2019 was 9.56×10^22 Joules, with a corresponding temperature increase of 0.0167°C. That heat energy increase is the energetic equivalent of 137,741 hurricanes. Now, of course, that Biosphere heat increase during 2019 did not all go into making hurricanes, but it should be easy enough to see that a small fraction (for a whopping amount) went into intensifying the weather and producing more and stronger hurricanes (and consequent flooding).

Two clear observations from all this are:

– the Biosphere is warming at an astounding rate, even if “we don’t notice it” because we gauge it by the annual change in average global surface temperature (which is in hundredths of degrees °C per year);

– the immense amount of heat added to the Biosphere every year is increasingly intensifying every aspect of weather and climate, and consequently driving profound changes to all of Earth’s environments.

Those environmental changes directly affect habitability, and species viability, because they are occurring at a rate orders of magnitude faster than the speed at which biological evolution can respond to environmental pressures.

What should we do about it all?

That is obvious: ditch capitalism and socio-economic inequities worldwide; ditch all forms of bigotry, intolerance, racism, war and social negativity; form a unified planetary political administration for the management of a socialist Earth; deploy reasonable technical mitigation strategies (like drastic reductions in the use of fossil fuels, transforming the transportation infrastructure); implement very deep and comprehensive social adaptation behaviors (“lifestyle changes,” eliminating consumerism, scrupulously protecting biodiversity, resettlement of populations displaced by permanent inundation or uninhabitable drought and heat, worldwide sharing of food production).

None of this will actually stop global warming, as the amount of carbon dioxide already in the atmosphere (assuming it has a lifetime there of thousands of years [2]) has us programmed to warm by about another 1°C to 2°C within two centuries, even if we immediately and permanently shut off all our greenhouse gas emissions.

But, such an improved civilization would experience the least amount of suffering — which would be equitably distributed — from the consequences of advancing global warming; and it would contribute minimally toward exacerbating future global warming.

Notes

[1] The Energy of a Hurricane
5 September 2008
https://www.counterpunch.org/2008/09/05/the-energy-of-a-hurricane/

[2] Global Warming and Cooling After CO2 Shutoff at +1.5°C
20 June 2020
https://manuelgarciajr.com/2020/06/20/global-warming-and-cooling-after-co2-shutoff-at-1-5c

<><><><><><><>