Nate Hagens, on Earth and Humanity

Watch the video presentation “Earth and Humanity: Myth and Reality,” (2:52:15) by Nate Hagens, linked below. Hagens presents an analysis and grand synthesis of the multi-entwined crises of unsustainable human society living in the rapidly degrading world climate of an increasingly resource-depleted and increasingly inhospitable Planet Earth.

I guarantee that you will find many of your own views on this topic reaffirmed by Hagens, and also that he will challenge at least one of your cherished beliefs about it. This is good for serious people, it prompts them to think anew, and to rethink their assumptions.

What impresses me about Hagens’ analysis is that it is based on a wealth of data — the lifeblood of any real scientific or economic analysis — and that it is a multidimensional systems analysis, and not merely a “one note Johnny” narrow expertise (just finance, or just physics), single “smoking gun” caused problem (as the “overpopulation” reductionists claim) or a promotion of a single route to salvation solution (as the “nuclear power” reductionists claim). Hagens’s is an integrated description of the dysfunctional global system, which Nature plus Humanity has become, rather than merely being an uncoordinated list of a myriad of disconnected disasters, pathologies, ruins and wrecks.

Hagens does make specific recommendations near the end of his video, aimed at getting us (particularly in the U.S.A.) to begin dealing with our ongoing global systems failure in a substantive manner. After that he adds a few seconds of wordless video that will delight all lovers of wildlife.

Any abstraction of Hagens’ presentation to a single phrase would wash away all its insights and nuance, and would be unjust to the cause of transmitting understanding to the public. But, if you want an indicative soundbite, here is my maximally reductionist summary: humanity needs to scale back its use of energy very very significantly, and permanently, and now — an energy diet — just like a forever-maintained eat-less food-calorie diet needed to break an individual free from obesity.

Hagens’ video will make any serious person think (and we all better get serious), and that is the first essential step for us ever having a chance to get out of the mess we’re in.

Earth and Humanity: Myth and Reality
16 May 2021 (Nate Hagens)
https://youtu.be/qYeZwUVx5MY

The following two paragraphs are my abstraction and consolidation of internet descriptions of Nate Hagens, with much of this information drawn from The Post Carbon Institute (https://www.postcarbon.org/our-people/nate-hagens/).

Nate Hagens has a Masters Degree in Finance from the University of Chicago and a PhD in Natural Resources from the University of Vermont. He is a former editor of The Oil Drum and worked on Wall Street for a decade before “seeing the light.” Since 2003 Nate has shifted his focus to understanding the interrelationships between energy, environment, and finance and the implication this synthesis has for human futures. Previously, Nate was President of Sanctuary Asset Management and a Vice President at the investment firms Salomon Brothers and Lehman Brothers. Currently, he teaches a systems synthesis Honors seminar at the University of Minnesota ‘Reality 101 – A Survey of the Human Predicament.’

Nate focuses on the interrelationship between debt-based financial markets and natural resources, particularly energy, and the unplanned for risks from the coming ‘Great Simplification.’ He also addresses the evolutionarily-derived underpinnings to status, addiction, and our aversion to acting about the future and offers suggestions on how individuals and society might better adapt to the coming decades.

Jeff Gibbs 2019 video “Planet of the Humans,” released publicly on Earth Day 2020, was the most important presentation on the realities of our global “climate change” crisis to be made available in many years (https://planetofthehumans.com/). Nate Hagens’ new video “Earth and Humanity: Myths and Reality” is of much grander scope and at least of equal importance. See it and don’t get defensive, then refine your own stance from your points of disagreement with Hagens, and/or improve his systemic analysis, which is the type of thing needed to converge politically on what in all honesty would have to be called a World Plan for guiding human civilization through a transition — the Great Simplification — to a post carbon future, without suffering a catastrophic and life-ending collapse.

As a 20th century mechanical engineer who focused himself on the 19th century science of thermodynamics (and got away with a career in experimental nuclear explosions), I’ve said all what little I was competent to say about the physics and economics of “climate change.” So at this point all I can offer on the topic is bad poetry, and I’ll spare you that. But I can also recognize the value of new presentations like those of Gibbs and Hagens, and urge others to see them, study them, and act on them.

I am mindful of the urgent and totally justified demand posed by the next generation onto us world-controlling and world-destroying adults, through the voice of Greta Thunberg, for “action!” Nate Hagens’ systemic analysis is a very important step toward answering the questions of “what actions?” and “how do we implement them?”, and of actually working on Greta’s demand.

[Thanks to Isabel Ebert for pointing me to Nate Hagens’ video.]

<><><><><><><>

ADDENDUM:

Richard Heinberg both appears in “Planet of the Humans,” and leads the Post Carbon Institute.

The Most Colossal Planning Failure in Human History
May 2021
Richard Heinberg
https://richardheinberg.com/museletter-339-the-most-colossal-planning-failure-in-human-history

<><><><><><><>

Our Globally Warming Civilization

<><><><><><><><><><><><><><><><><><><><><><><><><><><><><><><><>

Our Globally Warming Civilization

The 150 years of the Industrial Revolution (~1770-1920), with its catastrophic and bloody termination in World War I (1914-1918), had no noticeable effect on the global average temperature, which had hovered around 14.7 degrees Centigrade (C) since antiquity. The human population had taken 200,000 years (more or less) to grow to one billion (1B), in 1804, within the natural and majestic evolution of global climates during those 2000 centuries, (1).

By 1927, the human population had increased to 2B. The 1920s were economic boom years in the Industrialized World (give or take some post WWI German misery, the Russian Revolution, and Chinese civil warfare) with the liquid petroleum replacing the solid coal as the fossil fuel of choice for transportation vehicles; and the explosion in the craving for, and manufacture and use of, internal combustion engines and the automobiles powered by them.

After 1927 the rate of population growth increased from what it had been on average during the previous 123 years (about 8 million per year, ~8M/yr) to an average rate of 29M/yr, to accumulate another 0.7B people in the 26 years up to 1953, when the population was 2.7B. Those 26 years between 1927 and 1953 spanned the crescendo of the Roaring ‘20s, the capitalist economic collapse of 1929, the Great Depression (1929-1942), World War II (1939-1945), the Second Sino-Japanese War (1937-1945), and the Chinese Communist Revolution and Civil War (1946-1949).

I estimate that the cumulative amount of petroleum produced (pumped out and used up) by 1953 was 98.6 billion barrels (98.6 giga-barrels, 98.6Gb), (2). This implies that since about 1900, when civilization’s use of petroleum as a fuel began in earnest, it consumed 602 giga-GJ (602 x 10^18 Joules) of energy (equivalent to 168 mega-GWh = 168 x 10^9 MWh = 168 giga-mega-watt-hours) to power itself up to 1953, (3).

By 1960, the world’s human population had reached 3B, and the rate of population growth was accelerating (having been about 43M/year during the previous 7 years). From 1960 to the present day, the trend of cumulative production of petroleum, Q, has been proportional to the rising trend of human population, in the ratio of 272 barrels of oil per person (272 b/p).

Specifically, my approximating formula for Q, the accumulated production of oil in giga-barrels (Q, in Gb), given as a function of the population in billions (P, in B) for a given year within the interval 1960 to 2025 is:

Q(year) = [P(year) – 2.7B] x (272 b/p).

This approximation gives an accumulated production up to 2015 (with population 7.35B) of

Q(2015) = 1265Gb, (approximation).

By integrating the actual production rate-per-year curve (the “Hubbert curve” for world production, in GB/yr) given by Laherrere (2), I find the actual accumulated production up to 2015 to be:

Q(2015) = 1258Gb, (actual).

The rate of oil production is now likely at its peak of between 25 Gb/yr to 35 Gb/yr during this 20 year interval between 2005 and 2025, (2),(4). Thereafter, it should drop rapidly since current oil fields have diminishing production, there have been no major oil field discoveries since the 1970s and the frequency of discovery has steadily diminished since then. That means that over half of Earth’s original total reserves, estimated at 2,200Gb (2), have already been extracted. The “end-of-oil” seems destined for the last two decades of the 21st century.

Assuming all that oil was burned, up to the year 2015 (115 years since 1900), civilization would have used 7,674GGJ, (7,674 x 10^18 Joules), equivalent to 2,139GMWh, (2,139 x 10^15 Watt-hours) of energy, derived from that 1258Gb of petroleum, to power itself.

That burning would have released 398,786Gkg (~4 x 10^14 kg = ~400 giga tonnes) of CO2, (5). At present (May 2019) there are about 3,250 giga tonnes of CO2 in the atmosphere, with an average concentration of 415 parts per million by volume (415ppmv), (6). 1228 G tonnes of that CO2 is excess above the pre-industrial amount in the atmosphere. The ~400 G tonnes estimated here as the accumulated emissions from the prior burning of petroleum (up to about 2015) is only about one-third of the excess atmospheric CO2.

There are numerous other processes in our civilization, as well as in the natural world, that cause the emission of carbon-dioxide and its atmospheric retention in excess amounts. The main sources of CO2 emissions are the exhalations from aerobic respiration by all of Earth’s living heterotrophs, decaying plants, and volcanic eruptions. Other sources include: the burning of coal and natural gas, forest and vegetation fires caused naturally and by slash-and-burn agriculture, the bubbling out of CO2 from warming oceans no longer able to dissolve as much of that gas as before, and the massive amount of past and continuing forest clearing that has reduced Earth’s natural system of CO2 uptake — photosynthesis. The cement industry is one of the two largest producers of anthropogenic carbon dioxide, creating up to 5% of worldwide man-made emissions of this gas, of which 50% is from the chemical process and 40% from burning fuel, (7).

Methane (CH4) is a very potent greenhouse gas, being 30 times more effective than CO2 at trapping heat. “For each degree that Earth’s temperature rises, the amount of methane entering the atmosphere from microorganisms dwelling in lake sediment and freshwater wetlands — the primary sources of the gas — will increase several times. As temperatures rise, the relative increase of methane emissions will outpace that of carbon dioxide from these sources.” (8) Other sources of methane emissions are: rotting organic wastes, termite colonies, and bovine flatulence from industrialized agricultural sites. The globally warmed thawing Arctic tundra is now a region of major methane eruptions.

Up until 1974, when the human population had reached 4B, Earth’s climate system had yet to become feverish over the previous 200,000 years of collective human activity. However, at about that time the average global temperature began increasing at a historically unprecedented rate because of civilization’s heated and organic outgassing, a process which continues today as anthropogenic global warming, (9).

In fact, the date at which collective human activity began to affect and alter Earth’s climate system has now been pinpointed to somewhere between October to December 1965. That date marks the end of the Holocene Epoch of geologic history (which began 11,700 years previously, after the last Ice Age), and the beginning of the Anthropocene Epoch — the epoch of human-affected climate, globally. The physical phenomenon marking this transition is that Carbon-14, a radioactive isotope released during open-air atomic and nuclear bomb explosions between 1945 and 1963, had finally dispersed uniformly around the globe, and become absorbed into tree tissues even in the remotest parts of the world, thus recording that uniformity (10).

Between 1960 and 2025, the three rising trends of: population (P), cumulative oil production (Q), and increase of average global temperature above baseline (T – 14.7C = delta-T), are all uniformly proportional to one another.

Specifically (for years between 1960 and 2025) T, P and Q are related to each other as follows:

[T(year) – 14.7C] = [P(year) – 2.7B]/3.3B = [Q(year)/(900 Gb)],

where the forms above are each equivalent to a temperature difference relative to the baseline of 14.7C (delta-T, in degrees C).

Notice that if T = 15.7C, and P = 6B, and Q = 900 Gb, then the equality above holds, with: 1 = 1 = 1. This particular condition actually occurred during 1999.

During this 65 year interval, a 1 degree C rise in temperature (above 14.7C) is coincident with a 3.3B increase in population (above its 1953 level of 2.7B), which in turn is coincident with a production (and use) of 900Gb of petroleum.

The population is growing from 3B in 1960 to an expected 8B in 2028 during this 68 year interval, with an average population increase of +73.5M/yr. Within these 68 years, and especially during the 55 years from 1970 to 2025, the rising trends of (T – 14.7C), (P – 2.7B)/3.3B, and Q/(900Gb) are in lockstep. This period — with explosive population growth, depletion of over half of the Earth’s petroleum endowment, and with an unprecedented rate of global warming — began in the last year of the Eisenhower Administration, 1960, when John Kennedy was elected US President, and extends right up to the present (and beyond it).

The average global temperature will have climbed up from ~15C to ~16.2C during this interval, a relative rise of 1.4C, and a rise of ~1.5C (delta-T = ~1.5C) above the pre-industrial temperature, defined here as 14.7C (58.46 degrees Fahrenheit). That 1.5C (2.7F) warming above the pre-industrial temperature represents a tremendous amount of heat energy diffused throughout the biosphere, and the deleterious effects of that excess heat are self-evident to all: the altering of climate; the powering of violent weather; the heating and acidifying (with absorbed CO2) of the oceans, sterilizing them of marine life; the melting of glaciers and thawing of tundras; the causing of carbon dioxide and methane to bubble out of solution and frozen capture in the natural world (in a vicious feedback loop); the expansion of disease pathogens and tropical parasites; and the added stresses to both wild and farmed vegetation, and increased desertification, which result in human hunger and desperate migrations of impoverished refugees.

Now, our civilization is starting to suffocate in the lingering heat of its previous exhalations. The singular challenge to our species and to our political economies is what to do, collectively, about global warming. That challenge remains largely unanswered, and tragically denied by too many people .

Notes

1. World population is estimated to have reached one billion for the first time in 1804. It was another 123 years before it reached two billion in 1927, but it took only 33 years to reach three billion in 1960. The global population reached four billion in 1974 (14 years later), five billion in 1987 (13 years later), six billion in 1999 (12 years later), and seven billion in October 2011 (12 years later), according to the United Nations, or in March 2012 (13 years later), according to the United States Census Bureau.
https://en.wikipedia.org/wiki/World_population

World population by year
https://www.worldometers.info/world-population/world-population-by-year/

2. Jean Laherrere, World Crude Oil Production, (brown line), April 2015
https://upload.wikimedia.org/wikipedia/commons/4/46/World_crude_discovery_production_U-2200Gb_LaherrereMar2015.jpg

3. The energy released from combusting 1 barrel of oil is 6.1 giga-joules (6.1 GJ), which equals 1.7 MWh (1.7 mega-watt-hour).
https://en.wikipedia.org/wiki/Barrel_of_oil_equivalent

4. Worldwide, around 92.6 million barrels of oil were produced daily in 2017.
https://www.statista.com/statistics/265203/global-oil-production-since-in-barrels-per-day/
~73 million barrels/day in 1998, rising since.
73 Mb/day = 26.7 Gb/yr (1998)
93 Mb/day = 34.0 Gb/yr (2017)
During 20 years of production (1998-2017) the rate rose 20 Mb/day = +1 MB/day/year

5. Burning one barrel of petroleum can produce between 317kg (realistically) to 433kg (theoretically) of CO2:
Realistic
http://numero57.net/2008/03/20/carbon-dioxide-emissions-per-barrel-of-crude/
Theoretical
https://www.answers.com/Q/How_much_CO2_produced_by_burning_one_barrel_of_oil
Therefore, the CO2 emitted by combusting 1b = 317kg CO2.

6. As of January 2007, the earth’s atmospheric CO2 concentration is about 0.0383% by volume (383 ppmv) or 0.0582% by weight. This represents about 2.996×10^12 tonnes (1 tonne = 1000kg), and is estimated to be 105 ppm (37.77%) above the pre-industrial average (~278 ppmv).
https://micpohling.wordpress.com/2007/03/30/math-how-much-co2-by-weight-in-the-atmosphere/

415 ppmv of atmospheric CO2, as of May 2019
https://en.wikipedia.org/wiki/Carbon_dioxide_in_Earth%27s_atmosphere

Therefore:
(415/383) x 3000 G tonnes = 3,250 G tonnes, (May 2019).

7. Environmental impact of concrete
https://en.wikipedia.org/wiki/Environmental_impact_of_concrete

8. Methane is roughly 30 times more potent than CO2 as a heat-trapping gas
https://www.sciencedaily.com/releases/2014/03/140327111724.htm

9. I first constructed the simplified plot of average global temperature in 2004, using data from public sources. Details about that construction and the data used are given at:
Population, Oil and Global Warming, 31 May 2019 (15 March 2004)
https://manuelgarciajr.com/2019/05/31/population-oil-and-global-warming/

10. The Anthropocene Epoch began sometime between October and December 1965.
https://manuelgarciajr.com/2018/02/23/the-anthropocenes-birthday/

<><><><><><><>

Population, Oil and Global Warming

Our ignorance is not so vast as our failure to use what we know.
—M. King Hubbert (1903-1989)

<><><><><><><><><><><><><><>

This article is identical to:

Oil, Population And Global Warming
15 March 2004
http://www.swans.com/library/art10/mgarci10.html

The only change is the addition of the graphs (below), which I made today (30 May 2019).

Numbers beyond the year 2020 are speculative (by the sources cited). Numbers for oil used to date (globally) are less certain than the numbers for population and average global temperature. The temperature history has been simplified (you can find very detailed data if you wish). Oil extraction by fracking since ~2000 (and since this article was originally published, in 2004), has drastically changed the numbers for oil production in the United States.

<><><><><><><><><><><><><><>

Future historians will look back on the 200 years of the 20th and 21st centuries as the Oil Period in world history. During this time, the latent heat of buried petroleum will have been mined and released into a dramatically warmed and crowded planetary surface. In the century from 1950 to 2050, the world will have shifted from one with 2.7 billion people, 96% of its petroleum reserves intact, and insignificant global warming, to one with perhaps over 9 billion people, less than 10% of its petroleum reserves left and a 2 °C average global temperature rise. For perspective, during the last Ice Age — about 16,000 years ago — the average global temperature was 4 °C (7 °F) below the 1860 to 1920 average of 14.7 °C (58.5 °F).

What will be the politics of a hot, crowded world without oil, and possibly on the brink of abrupt climate change?

Oil

Within the sixty years from 1970 to 2030, we will have used up about 80% of the world’s oil, the peak rate of production occurring now, during these few years about the turn from 20th to 21st century. Half of the world’s oil endowment has already been used. Efforts at conservation and improved extraction technology may extend till the years 2007 to 2013 when the oil production rate will peak (at about 26 billion barrels/year, or 70 million barrels/day). Inevitably, beyond this time the rate of oil extraction will diminish.

The bell-shaped curve of oil production rate variation over time is called the Hubbert Peak, in honor of the late geophysicist who — in 1949 — first predicted the brevity of the fossil fuel era. Hubbert’s 1956 prediction that US oil production would peak in 1970 and then decline was scoffed at, but he was proven exactly correct. (1), (2)

Today [15 March 2004], over 87% of the oil endowment in the continental U.S., and over 95% of that in Alaska have been consumed. America uses 28% of the world’s yearly oil production, producing 12% domestically, and importing the remaining 16%. Americans consume oil at six times the rate of the world average (25 versus 4 barrels/person/year). America imports oil to supply 29% of the energy it consumes, domestic oil supplying another 12%, so that 41% of our energy comes from oil. This fact is fundamental to national planning. (3), (4)

Oil used (accumulated giga-barrels, GB) by a given year (estimated)

People

World population increased at an accelerating rate until 1990 (when 85 million people joined us), and has continued increasing at a diminishing pace since. The world family was 2 billion people in 1930, 3 billion in 1959, 4 billion in 1974, 5 billion in 1987, and 6 billion in 1999. Estimates published by the US Census Bureau show a potential world population of 7 billion by 2013, 8 billion by 2028, and 9 billion by 2048. The future US population is estimated to be 4.5% of the world total, as it is today. (5)

World population (billions, B) vs. year

Temperature

Instrumental records of global surface temperature begin in 1860. The average global surface temperature for the period between 1961 and 1990 was 15 °C (59 °F). The deviations of global surface temperature, relative to the reference temperature of 15 °C, are — very generally! — as follows: -0.4 °C prior to 1920, a rise to 0 °C by 1940 (being at 15 °C), a plateau at +0.1 °C during 1940-1945, a lower plateau at -0.05 °C during 1945-1975, a rise to +0.6 °C by 2000. The actual year-to-year variations within each of these five periods are within a swing of 0.2 °C either way. (6), (7)

The temperature rise after 1975 is unprecedented (averaging +0.03 °C/year). The temperature today is 1°C (1.8 °F) warmer than in the late 19th century. The initial 40% of this temperature rise took 55 years, while the final 60% only required 25 years.

It is interesting to view the finely-detailed temperature history presented by the United Nations Environment Programme, and to imagine the warming trend beginning in 1920 as reflective of the oil boom then underway, as the industrialized nations moved from coal to petroleum for their energy; and to the warmth during WWII, which was not equaled until the 1980s.

Predictions of global warming above the early 20th century temperature of 14.7 °C are +2.3 °C in 2050 (between +1.5 °C and +3 °C), and +3.3 °C in 2100 (between +2.1 °C and +6.5 °C). (8)

Average global temperature (degrees Centigrade, C) vs. year (simplified)

Is it possible to directly relate temperature rise with human activity? For example, linking fossil energy, greenhouse gases, and global warming? What about fossil energy, industrialized agriculture, energy-intensive social systems and human population? Finding causal links to global warming is a scientific problem of great complexity, and one that has engaged many scientists for at least two decades. (9), (10)

However, without appealing to causal arguments, it is sometimes possible to show that trends for two phenomena coincide. If so, some limited insight might be found by contemplating this.

Proportionality, people and oil

The growth of human population, the depletion of oil resources and the rise of global temperature each mirror one another to a remarkable degree, a result that can be arrived at from the data and projections already described.

The world population of 2.7 billion by 1953 can be taken as a base that required negligible petroleum energy to produce. The addition of people beyond this level is fueled at a rate of 264 barrels of oil per person.

So, population minus the base equals cumulative oil production in barrels divided by 264 (equation 1).

For example, today’s population of 6 billion required the expenditure of 871 Gb (Gb is for Giga-barrel, or 1 billion barrels); the actual consumption by January 1999 was 857 Gb. Similarly, a projected population in 2050 of 9 billion would coincide with an accumulated depletion of 1,663 Gb, or 95% of the estimated 1,750 Gb of the world’s oil endowment.

The actual population and cumulative oil production data between 1950 and 2000 correlate startlingly well with the proportionality and offset (base population) given here. The projections to 2050 also correlate extremely well, but of necessity they contain uncertainties only time can clarify.

Proportionality, people and temperature

By direct comparison, the trends of temperature rise above 14.7 °C (the pre-1920 plateau) and population growth mirror each other after 1975 with a proportionality of 3.3 billion people per °C.

So, the difference of population minus base, divided by 3.3 billion equals the temperature difference above 14.7 °C (equation 2).

For example, the 6 billion people of today coincide with a rise of 1 °C to 15.7 °C (60.3 °F), and the projected 9 billion people of 2050 would coincide with a rise of 1.9 °C to 16.6 °C (61.9 °F).

Proportionality, temperature and oil

By a ratio of the previous two proportionalities, one finds that for each 870 Gb of oil produced, the global surface temperature rises by 1 °C.

So, cumulative oil production in barrels divided by 870 Gb equals temperature rise above 14.7 °C (equation 3).

It has already been noted that today we have a global warming of about 1 °C above the 19th century level of 14.7 °C, and that just over 857 Gb of oil have been extracted; this matches the proportionality of 870 Gb/°C. The anticipated global warming in 2050, with 1663 Gb of oil having been extracted, would be 1.9 °C, for a temperature of 16.6 °C (61.9 °F).

Summary of proportionalities

Three proportionalities: 264 barrels/person, 3.3 billion people/°C, and 870 Gb/°C, correlate the data and projected trends in world population (above a base of 2.7 billion), cumulative oil production and global warming (above 14.7 °C). Population and oil production are correlated from 1950, while all three quantities are correlated after 1975.

Population (blue), oil (brown) scaled to match temperature rise (red) above 14.7 C, 1850-2050, (see text, proportionalities)

Population (blue), oil (brown) scaled to match temperature rise (red) above 14.7 C, 1950-2050, (see text, proportionalities)

Population (blue), oil (brown) scaled to match temperature rise (red) above 14.7 C, 1950-2020, (see text, proportionalities)

What’s Next?

Are we to believe that these correlations will remain intact until the world’s oil is exhausted? Will we really age to 2050 with an accumulation of 9 billion people, no petroleum, and unchanged climate despite a heating of unprecedented magnitude, comparable to the cooling of the Ice Ages?

Many find it easy to fantasize from this point: ice caps melt, oceans swell, shorelines recede so that countries like the Netherlands and Bangladesh disappear; jungles and deserts expand but in different locations than at present, waves of extinction and population-drop sweep the animal kingdom, equatorial zone agriculture collapses, massive migrations spark wars; America, Europe and Japan militarize heavily, including space, to capture foreign resources and repel invaders and refugees; America invades Canada because the ‘corn belt’ has moved north to the former tundra; the exploding price of oil spurs a frenzy of invention into synthetic fuels and alternate forms of energy, as well as a return to coal and a depletion of timber; sunny territory is invaded and conquered by foreign armies, and used for solar energy plantations by a colonial elite who export the accumulated energy to their imperial homelands.

Politics (finally!)

In fact, we don’t know what will happen, or when. But, we can “use what we know” to begin rational planning now for a transition to a new method of powering our society (particularly transportation systems), and of weaning ourselves from imported energy and the imperialism it seems to require. It would also be wise to rearrange our politics, that is to say remove the inequities between economic classes, so that our nation can retain its integrity while facing the environmental, economic and political pressures to be expected with a shift to a post-petroleum world. The added stress of a civil war during such a time would be tragically cruel.

Such planning is unlikely — at best very difficult — in America, because business has a quarterly-profits myopia, and the electorate in the suburban American “heartland” is thoroughly indoctrinated in capitalist ideology, with an anti-socialist “every man for himself (and women too)” attitude. The world’s revenge for our past imperialism may well be realized by our lack of social planning for the inevitable shocks of the collapse of the oil-powered economy, accompanied by a climate shift.

There are no physical reasons, no “laws of nature” that prevent us from devising an alternative way of organizing and powering our American society. There would certainly be many technical problems and intellectual challenges, but we have the means to prepare for what we can predict is likely to unfold. An enduring society would do this on a continuing basis. To me, that is socialism. Sometimes it’s as simple as seeing that everyone is in the boat, and they’re all rowing in the same direction.

In looking at our political figures, which ones seem to concern themselves with just the self-interest of one or another faction, and which ones seem to concern themselves with the good of the “whole boat?” We need leadership that can draw our involvement into long-term, democratic, social planning that achieves dependable commitments. We need such a process to bear fruit this decade, and we need a well-understood general plan for embarking on an intentional social transformation. If not, we will be the witless victims of a foreseeable catastrophe of our own making.

Notes

1.  “Hubbert Peak of Oil Production” – http://www.hubbertpeak.com (as of 29 February 2004).

2.  James M. MacKenzie, “Oil as a finite resource: When is global production likely to peak?” World Resources Institute, 1996 & 2000 – http://www.wri.org/climate/jm_oil_000.html (as of 24 February 2004).

3.  Energy Information Administration, U.S. Department of Energy – http://www.eia.doe.gov (as of 28 February 2004).
“Energy in the United States: 1635-2000” – http://www.eia.doe.gov/emeu/aer/eh/frame.htm
“25th Anniversary of the 1973 Oil Embargo” – http://www.eia.doe.gov/emeu/25opec/anniversary.htm
“U.S. Total Petroleum Consumption” – http://www.eia.doe.gov/emeu/25opec/sld007.htm
“Imported Oil as a Percent of Total U.S. Consumption” – http://www.eia.doe.gov/emeu/25opec/sld002.htm

4.  U.S. Department of Interior, Press Release, 19 March 2003 – http://www.doi.gov/news/030319.htm (as of 28 February 2004).

5.  Bureau of the Census, U.S. Department of Commerce “Population Clock,” – http://www.census.gov/main/www/popclock.html (as of 28 February 2004).
“World Population Information” – http://www.census.gov/ipc/www/world.html
“Total Midyear Population for the World: 1950-2050” (table) – http://www.census.gov/ipc/www/worldpop.html
“World Population: 1950-2050” (graph) – http://www.census.gov/ipc/www/img/worldpop.gif
“Historical Estimates of World Population” – http://www.census.gov/ipc/www/worldhis.html
“Annual World Population Change: 1950-2050” – http://www.census.gov/ipc/www/img/worldpch.gif
“Methodology and Assumptions for the Population Projections of the United States: 1999 to 2100” – http://www.census.gov/population/www/documentation/twps0038.html

6.  “Trend in global average surface temperature,” United Nations Environment Programme / GRID-Arendal – http://www.grida.no/climate/vital/17.htm (as of 24 February 2004).

7.  Intergovernmental Panel on Climate Change (IPCC) of the United Nations Environment Programme (UNEP) – http://www.unep.ch/ipcc (as of 28 February 2004).
“Variations of Earth’s surface temperature for the past 140 years (global), and the past 1000 years (Northern Hemisphere)” – http://www.unep.ch/ipcc/present/graphics/2001syr/large/05.16.jpg
“Variations of the Earth’s surface temperature: years 1000 to 2100” – http://www.unep.ch/ipcc/present/graphics/2001syr/large/05.24.jpg

8.  The reference temperature in [6] is 15.08 °C (the 1961-1990 average), while in [7] it is 15.43 °C (the 1990 value). This article uses the 1860-1920 plateau (estimated average) of 14.7 °C as the reference for global warming. So, the data and projections of temperature “deviations” and “variations,” from [6] and [7], have been adjusted to ensure consistency in describing global warming.

9.  “Global Warming,” National Oceanic and Atmospheric Administration – http://lwf.ncdc.noaa.gov/oa/climate/globalwarming.html (as of 24 February 2004)

10.  “What is Climate Change,” Government of Canada – http://www.climatechange.gc.ca/english/issues/what_is/index.shtml (as of 24 February 2004).

<><><><><><><>

The Changing American Population, 1610-2010

The population of English colonists on the eastern shores of what would eventually become the United States of America numbered 350 in 1610. Their descendants, along with those of the subsequent imported Black slaves, many immigrants (legal and illegal), and later remnants of the Native American population whose ancestors had populated this continent since as early as 14,000 years ago, reached a cumulative population of 308,745,538 individuals in 2010, within the political boundaries of the U.S.A.

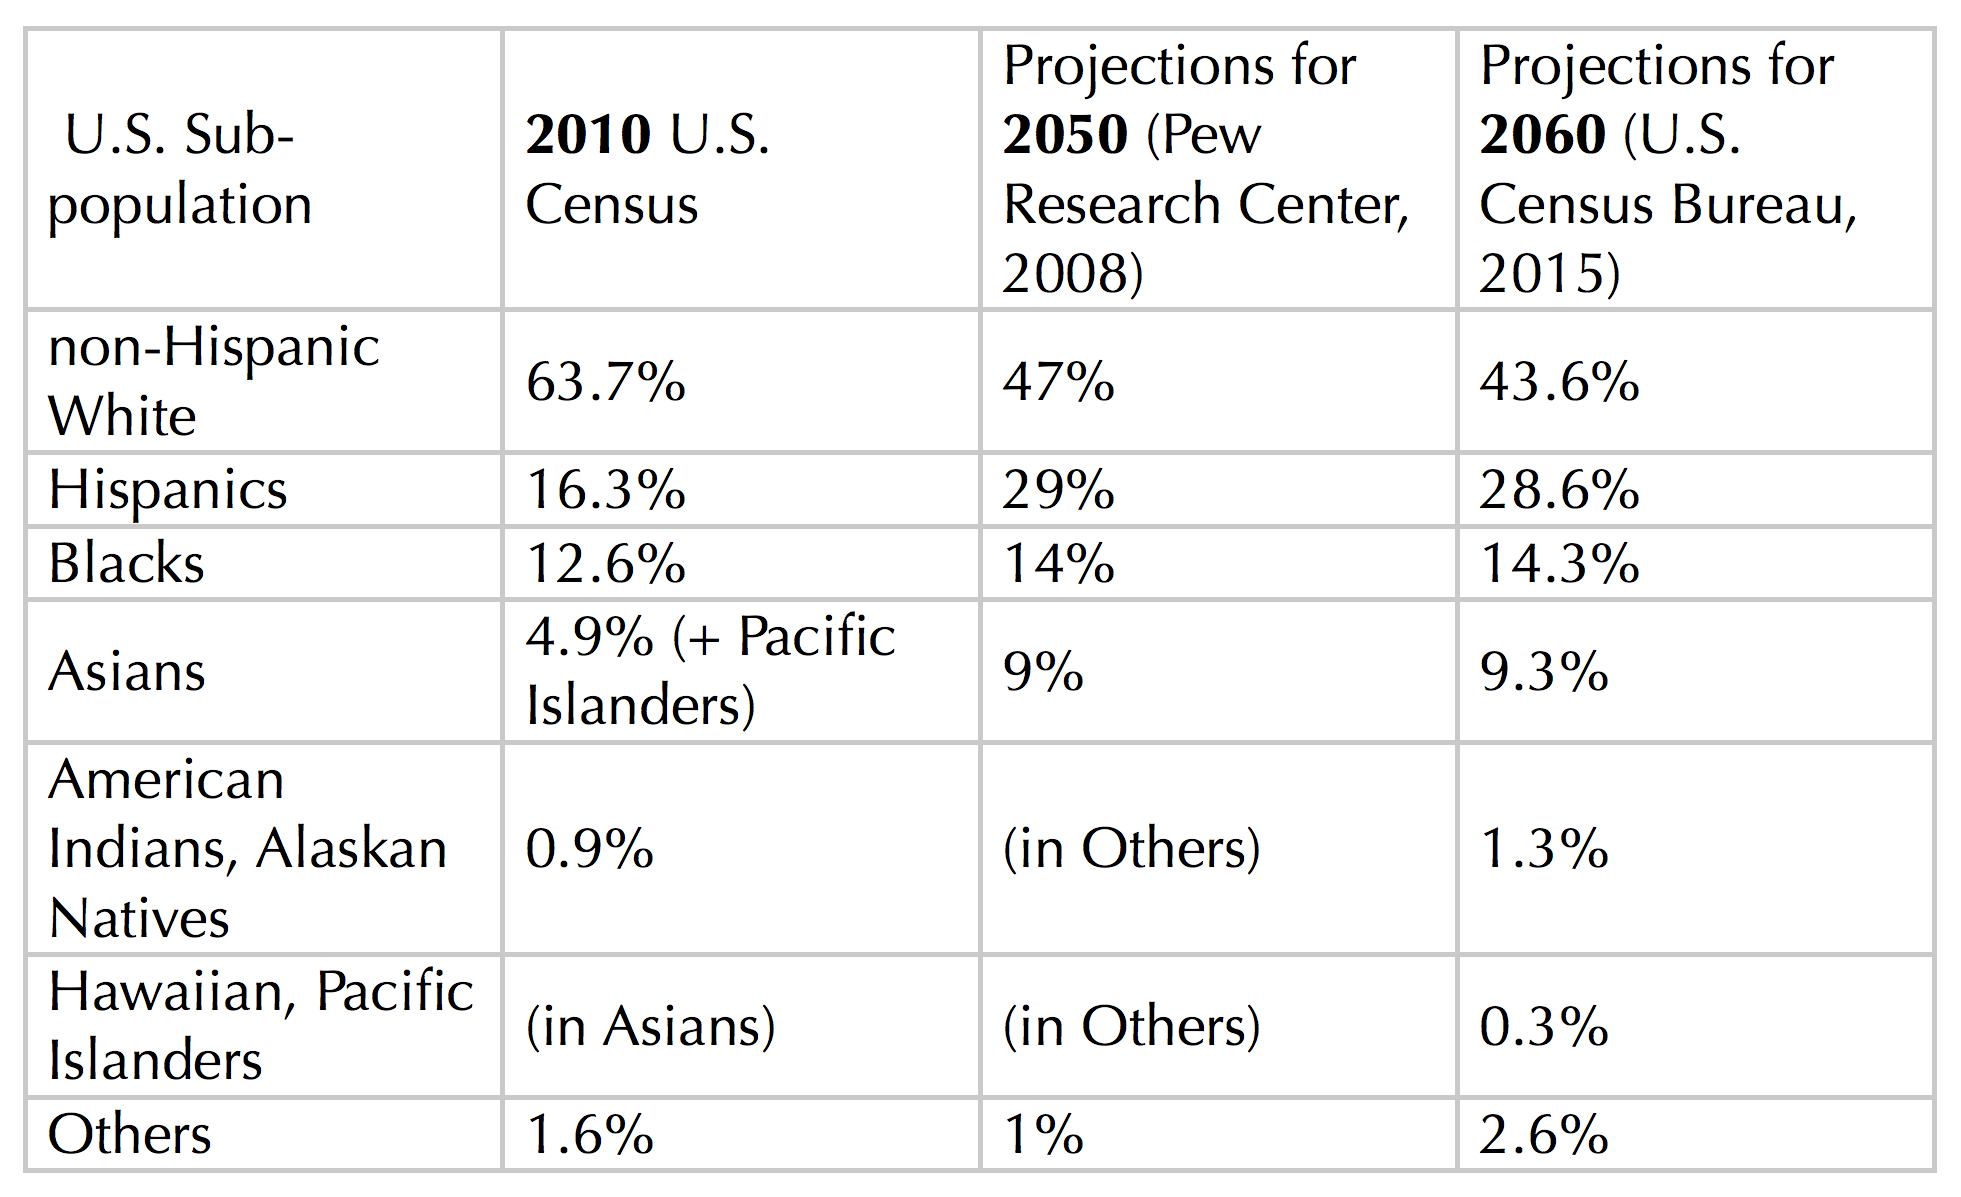
This essay is a very general and simplified overview of how the population within the territory of the United States has grown over the 400 years between 1610 and 2010. While there is a very wide spectrum of “races” and ethnicities in the U.S.A., this essay will focus on only three groups: White people, Black people and Latino (a.k.a. Hispanic) people. Both White and Black people are thought of as two racial groups; while Hispanic people have Spanish as their original language, and their cultures are based on it, and they can be of any race: White, Black, Red, Yellow, and any mix of these. The summation of the White, Black and Hispanic populations in the U.S. makes up nearly the total US population. Asian and Pacific Islander people make up only 4.9% of the US population (in 2010); and American Indian, Eskimo and Aleut people make up only 0.9% of the US population (in 2010).

An aside on “races”: Based on genetics there is only one race of humans, but the concept of human races — popularly treated as species! — based on skin color, facial and physiological features, is still too widespread and embedded in popular culture to be dispensed with here. Also, race is tabulated in U.S. Census data, upon which this essay is based.

What I am interested to learn is if I can understand the politics of a period from the demographics of that time.

I have made a few simple charts of the racial and ethnic population fractions in the United States for Whites, Blacks and Latinos, based on historical census data spanning the years 1610 to 2010 (https://en.wikipedia.org/wiki/Historical_racial_and_ethnic_demographics_of_the_United_States).

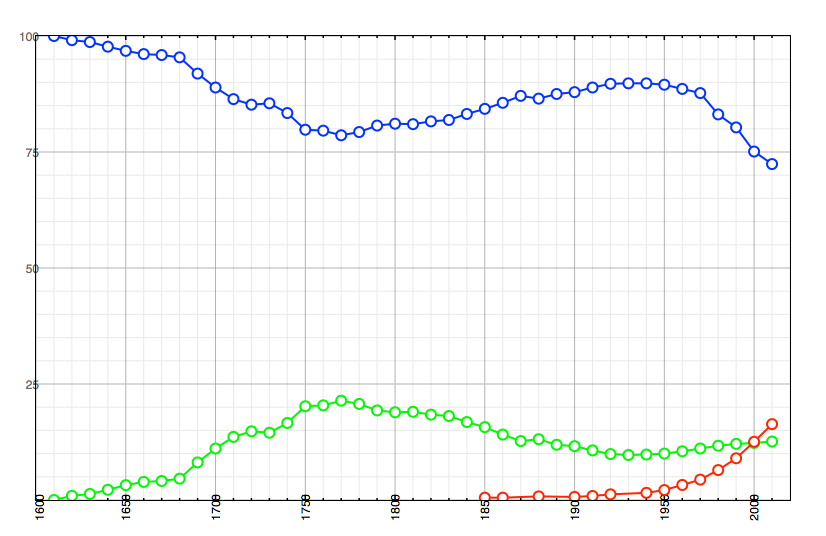
The first pair of charts (quantitatively identical, just with different data-set color schemes, for ease of viewing) show fractional populations as percents of the total US population, from 1610 to 2010. The top curve is for White people, the longer lower curve is for Black people, and the shorter lower curve, which begins at 1850, is for Latino (Hispanic) people.

This census data is not perfect. The United States Census has enumerated Whites and Blacks since 1790. Asians and Native Americans have been enumerated since 1860, though all Native Americans were not enumerated until 1890. A category enumerated since 1950 is “some other race,” and a category enumerated since 2000 is “two or more races.” Hispanics have been enumerated since 1940, with the exceptions of 1950 and 1960, but some estimates for the Hispanic population were made for certain years before 1940 as well as for 1950 and 1960.

The recorded percentages over time of the US population made up of Asian and Pacific Islander people are: 0 for 1610-1850; under 1% for 1860-1970; 1.5% for 1980; 2.9% for 1990; 3.8% for 2000; 4.9% for 2010.

The number of Native Americans in 1492 within the territory of the present day United States probably numbered 5 million people. By 1900 this population had dwindled to 237,196 (its minimum). It grew subsequently, reaching 1,420,400 in 1980, and 2,932,248 in 2010.

The growth of the total US population — as recorded by the imperfect census data — is shown in this next pair of charts.

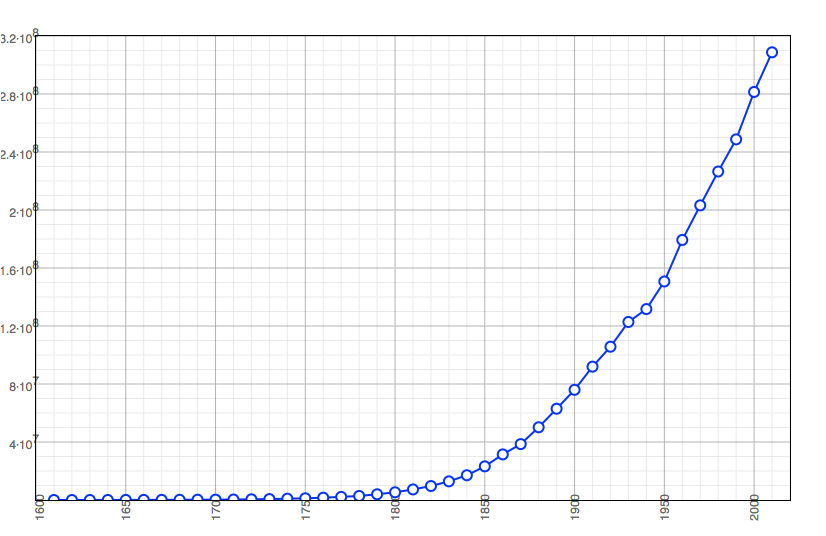
The first chart of this second pair of graphics is best for visualizing the grow of population above 5 million people, after 1800. The recorded population grew from 350 in 1610 to about 5 million in 1800. The second chart of this pair of graphics is a logarithmic (linear-log) representation of the data, and makes it possible to see the quantitative trend, especially prior to 1800.

Returning to the fractional population charts, notice the following features:

1610-1770

The fractional population of Whites dropped from 100% in 1610, to under 80% in 1770; with a corresponding rise in the fractional population of Blacks from 0% (a relatively small number in actuality) in 1610, to over 20% in 1770. In the Colonial America of 1770, 1 out of very 5 people was Black (remember, Native Americans were not counted). This (20%) is the maximum that the fractional population of Blacks ever achieved in American history (but of course, the absolute Black population has grown throughout US history). This growth in Black population was a result of the importation of enslaved Blacks from Africa. The total Colonial American population during this period grew from 350 to 2,148,076.

1770-1850

The fractional population of Whites rose from its local minimum of less than 80% in 1770, to almost 85% in 1850. The fractional Black population dropped from its local maximum of over 20% in 1770, to about 16% in 1850. A law banning the importation of slaves into the United States took effect in 1808, but slavery itself was not outlawed. Blacks were born into slavery if their parents were enslaved, and the absolute population of Blacks in the U.S. grew. This period of 1770 to 1850 corresponds to the Industrial Revolution, which was the transition to new manufacturing processes in the period from about 1760 to sometime between 1820 and 1840. This transition included going from hand production methods to machines, new chemical manufacturing and iron production processes, the increasing use of steam power, the development of machine tools and the rise of the factory system. Immigrants from Europe added to the White population in the U.S., for example Irish people seeking escape from their Great Famine of 1845 to 1852. The total American population during this period grew from 2,148,076 to 23,191,876.

1850-1900

The recorded (estimated) percentage of the US population made up of Hispanic people was under 0.8% between 1850 and 1900. In 1845, the United States annexed the “Republic of Texas” (Mexican territory occupied by “illegal immigrant” American slave owners seeking to expand the slave plantation system of the Southern U.S., westward). Mexico’s defeat in the subsequent Mexican-American War of 1846-1848, resulted in the loss of one-third of its territory to the U.S. That new US territory is the present day American states of Texas, New Mexico, Colorado, Arizona, Utah, Nevada and California.

The fractional population of Whites rose from nearly 85% in 1850, to about 87% in 1900; while the fractional population of Blacks dropped from about 16% in 1850, to about 13% in 1900. This half-century period encompassed the Civil War, the Indian Wars in the American West, and the Spanish-American War, when the United States became an overseas empire. The total American population during this period grew from 23,191,876 to 75,994,575.

1900-1930

Between 1900 and 1930, the fractional White population rose from 87% to 90%, while the fractional Black population dropped from 13% to under 10%. This thirty year span included the latter Gilded Age, World War I, the Roaring Twenties, and the Crash of 1929, which was the beginning of the Great Depression. The total American population during this period grew from 75,994,575 to 122,775,046.

1930-1940

The years 1930 to 1940 spanned most of the Great Depression (which actually occurred from 1929 to 1942), and are a local maximum of fractional White population (~90%), and a local minimum of fractional Black population (~9%). The fractional Hispanic population during 1930 to 1940 rose from about 1.3% to 1.5%. The total American population during this period grew from 122,775,046 to 131,669,275.

1930-1950

Between 1930 and 1950, the fractional White population remained at close to 90%, while the fractional Black population remained at close to 10%. This twenty year period included the Great Depression, World War II, and the brief Cold War period just after World War II and just prior to the outbreak of the Korean War in 1950. The fractional population of Hispanics rose from about 1.3% to 2.1% during 1930 to 1950. The total American population during this period grew from 122,775,046 to 150,697,361.

1950-1970

Between 1950 and 1970, the fractional White population dropped from its highest proportion since 1700 (about 90%) to nearly 88%. The fractional Black population rose from 10% to 11%; and the fractional Hispanic population grew at an accelerating pace — more than doubling — from 2.1% to over 4.4%. The rapid increase in US Latino population was a result of their higher fertility, and increased immigration from Mexico, Central and South America, and the Caribbean.

The people on the island of Puerto Rico, captured during the Spanish-American War of 1898, were given US citizenship in 1917, but not the right to vote in US national elections, nor were Puerto Rico’s elected representatives allowed to vote in the U.S. Congress (to this day). But, that extension of US citizenship for Puerto Rico came just in the nick of time for the Wilson Administration to draft men from Puerto Rico to fight (and presumably some die) in World War I, and similarly in the subsequent wars of the United States. Puerto Ricans who want to vote in US elections have to migrate to the US mainland and settle there, which many did during the 1940s and 1950s, primarily to seek better economic opportunities. The musical “West Side Story” is an artistic artifact inspired by this wave of immigration from Puerto Rico to the US mainland.

The twenty year span of 1950 to 1970 included: most of the postwar boom (occurring primarily from 1948 to 1971), which encompassed the last two years of the Truman Administration, and the Eisenhower, Kennedy and Johnson Administrations, and the first two years of the Nixon Administration, as well as the Vietnam War up through the time of the American invasion of Cambodia, ordered by the Nixon-Kissinger Administration. The total American population grew from 150,697,361 in 1950, to 203,210,158 in 1970.

1970-2010

The total American population grew from 203,210,158 in 1970, to 308,745,538 in 2010.

During the 40 years between 1970 and 2010, the fractional White population dropped significantly from 88% to 72%. The fractional Black population rose modestly from 11% to 12.6%; and the fractional Hispanic population zoomed from 4.4% to 16.3%. In the year 2000, the fractional Black and fractional Hispanic populations were essentially equal (12.3% and 12.5%, respectively), and subsequently the fractional Hispanic population became larger, and continued growing faster.

The rapid rise of the fractional Hispanic population subsequent to 1950, and especially since 1970, is responsible for the accelerating drop in the fractional White population (since the fractional Black population has changed little, and other fractional populations, as for Asians, are still relatively small).

The increase of the Hispanic population beyond that of the Black population after 2000, along with the corresponding drop in the fractional White population, has fueled the racial tensions expressed today as the Trump Administration: widespread Black resentment of Latinos (“Mexicans”), and the overt exercise of political power by White Supremacy: anti-immigrant and deportation policies against “illegal” Mexicans and people from Muslim-dominant countries, as well as voter suppression efforts aimed at Blacks and poorer Hispanics (many ethnically Mexican and Central American).

Trumpism is the combination of fear of demographic dilution — held by previously dominant racial-ethnic sub-populations; and of insatiably desperate exclusionary avarice seeking climax before our Pompeii-like climapocalyptic termination — held by the traditional, dominant and uppermost classes of American wealth.

Most of the undocumented (“illegal”) Central American immigrants to the United States were and are actually refugees from countries whose economies have been withered by US corporate vampirism backed by both direct and indirect US military interventions propping up corrupt and viciously cruel oligarchic client regimes. This predatory US imperialism “south of the border” stretches back to the Mexican-American War of 1846-1848, and includes many US Marine invasions and occupations prior to World War II, as famously condemned by General Smedley Butler (who was awarded several Medals of Honor for his heroism during such actions, in his earlier years when he commanded troops in them).

During World War II, President Franklin Roosevelt instituted the “Good Neighbor Policy,” which amounted to the U.S. being nice to Latin America and buying its export products at good prices for the producers (for example buying the entire Cuban sugar output during the war years), so as to induce the countries of the Caribbean and Central and South America to remain neutral in that war, instead of cashing in by provisioning Germany, and allowing its submarines to harbor safely in Latin American ports, and thus be able to hunt for Allied (i.e., American) war supply ships close to US shores.

After World War II, the Good Neighbor Policy disappeared and it was back to the Monroe Doctrine modus operandi. And, Central American peasants fleeing economic starvation and political murder would go north (to this day). A particularly bad period in this regard was during the Nicaraguan Revolution (1962-1990), and during the Reagan Administration (1981-1988), which massively, overtly and surreptitiously prosecuted its proxy Contra War in Nicaragua, in support of the remnant army and police forces of the Somoza dictatorship, which had been deposed by Nicaraguan socialists during 1978-1979.

The Reagan Administration also carried on similar proxy wars in Guatemala and El Salvador. The neofascist forces the Reagan Administration backed and supplied were responsible for many excessively cruel and massively bloody deeds, which many people — including me — considered genocidal. After 1990, the Central American wars tapered off, but the fundamental struggle — of a peasantry seeking political freedom, economic control of their lives, social justice, and physical security from arbitrary exploitation, torture and murder by the death squads and militarized police forces employed by corrupt oligarchic client regimes — still continues in some Central American countries.

And so, streams of impoverished displaced living victims of American profiteering in Central America go north, hoping to find their personal salvations in the United States. Those that make it (legally or illegally) add to the Latino Population Tsunami that is altering the demographic layering of the US population.

How will our changing demographics change our future politics? Good question.

<><><><><><><>

Collage image “Xenophobia,” by Thomas Calderon, sent on 30 September 2018

<><><><><><><>

ADDENDUM, 2 October 2018

TRUMPISM is the combination of fear of demographic dilution — held by previously dominant racial-ethnic sub-populations; and of insatiably desperate exclusionary avarice seeking climax before our Pompeii-like climapocalyptic termination — held by the traditional, dominant and uppermost classes of American wealth. Between 1970-2010 (census years) White population dropped 15.3% (from 87.7% to 72.4%, of which 8.7% was Hispanic), Black population rose 1.5% (from 11.1% to 12.6%) and Hispanic population nearly QUADRUPLED (from 4.4% to 16.3%).

The trends shown above are what fuel U.S. white supremacy, both in sentiment and in political action. The growth of the US Hispanic population is driven overwhelmingly by a higher fertility rate, not immigration. White people, worldwide, are the richest “racial” population, and they have the lowest fertility rate (more money, less kids). “Darker” and poorer populations have higher fertility rates. Trumpism (which includes anti-abortionism for white people too), the Israeli occupation of Palestine, and the former apartheid by and for white South Africa were/are wars against demographic dilution, perpetrated by the wealthy white low ‘fertiles’ (WWLFs) against poor dark high ‘fertiles’, (PDHFs). These “heart of whiteness” wars against demographic dilution are also wars for exclusionary capital hoarding (“race capitalism”). Also, these wars are the echoes of the white slave owner fears of the 17th through 19th centuries (over slave revolts), and the European imperialism of the 18th through 20th centuries (colonial wars). There is a lot of resistance among the world’s people to tolerate each other, and share the Earth (for doing so would tumble capitalism, authoritarianism, patriarchy and religion).

<><><><><><><>